

Adaptive Thresholds | New AppResponse Adaptive Thresholds Reduces False Positives | Riverbed
Performance monitoring is typically based on comparing measurable values against a set of threshold values. In theory, the IT operations team determines what the thresholds for warnings and alerts should be and sets them. In practice, they usually have no idea what the appropriate values should be.
For example, “response time” usually varies based on the time of day and day of week. At night, when the network load is negligible, response times would likely be minimal, too. In the middle of the day, when the network loads increase, the thresholds should be a bit more tolerant.
Adaptive Threshold Analytics
Riverbed AppResponse 11.9 has fixed this problem by using the machine learning technique known as “adaptive thresholds.” Adaptive thresholds help deal with the problem of setting thresholds when you don’t know what they should be.
Adaptive thresholds work by analyzing historical data to determine what normal should be. In AppResponse, you can select a historical comparison interval (1 hour, 1 day or 1 week) and the tolerance factor. The alerting engine compares the current traffic to the historical and creates alerts if necessary. The historical data updates constantly with the latest data so it’s always current.
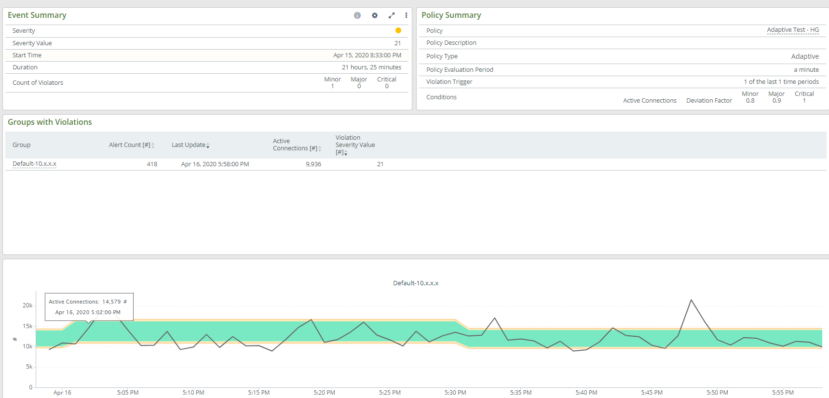
AppResponse adaptive threshold analytics proactively alerts on problems while reducing false alerts
AppResponse offers both user-defined and built-in adaptive thresholds. You apply user-defined adaptive thresholds on any metric for a specific network entity (i.e., an individual host, a host group, or an app, most commonly). Built-in policies apply an adaptive threshold to a set of network entities. There are two built-in adaptive policies:
- Application Response Time
- Host Group Traffic
The Application Response Time analytics builds a response time profile for every application defined on the system, while the Host Group Traffic analytics tracks total throughput for each defined host group on the system. The user is limited in how these two policies can be configured; for example, you can’t change the metric being measured, but can change the deviation factors and comparison interval. The user can also choose a subset of objects to monitor for a built-in policy, rather than all of them (the default).
In summary, user-defined adaptive policies let you monitor a broad set of metrics, but for a specific network object. The built-in policies are monitoring a specific metric but for a class of network objects (apps and host groups.)
Setup and configuration details
When first setting adaptive threshold policies, there’s a delay that is approximately equal to the chosen historical interval before alerting starts. For example, if you choose a threshold of one week, then a week must pass before the system collects enough historical data to be able to make a comparison to current data.
Another handy tidbit about configuring an adaptive policy is that administrators can do “what-if” analysis. This lets you see the approximate number of alerts that would be generated over a period of several hours, before the policy is actually configured. It also lets you adjust the tolerance parameters and see how the tolerance bands and detected anomalies adjust accordingly.
Benefits of Adaptive Thresholds
I think you’ll find that using AppResponse’s new adaptive threshold capabilities will reduce noise by reducing false positives. In addition, you won’t have to fiddle with live data anymore to find that perfect threshold. AppResponse does all the work for you, continuously. It’s always learning what’s normal, which means it proactively detects abnormal conditions, giving you early warning that something is amiss. Often you can detect impending trends before users feel the impact.
This post was first first published on Riverbed Blog’s website by Heidi Gabrielson. You can view it by clickinghere