

AI & Data Analytics help Extracting Business and App Intelligence

Application environments are changing, the way we build applications and the way we deploy them is changing.
Microservices deployed in containers across dynamic cloud infrastructure create an ephemeral and distributed environment at a scale we have never seen before. As a result, the old ways of doing application performance management (APM)—sampled transactions, incomplete traces, low resolution metrics—are no longer working. The detail that matters is lost and this is becoming painfully obvious as the environment grows more complex and the APM tools in place fail to diagnose why crucial business applications are still slow or stalling.
In these environments, slick dashboards and the occasional snapshot detail are not enough to pinpoint the often subtle and interdependent causes of issues. Today’s IT performance investigator needs to be equipped with better and more complete diagnostic data, and with a variety of analytics tools to slice and dice and visualize the data from a number of different perspectives.

Riverbed continuously captures end-to-end transaction trace data, user and device data, application log data, fine-grained infrastructure metrics, and network packet data, even in large-scale overhead-sensitive enterprise production environments, to deliver a unified monitoring solution suitable for today’s cloud native applications.
Let’s examine how a few different types of analytics can be applied to this data set to extract big data driven, business-relevant application insight for identifying, diagnosing, and prioritizing issues.
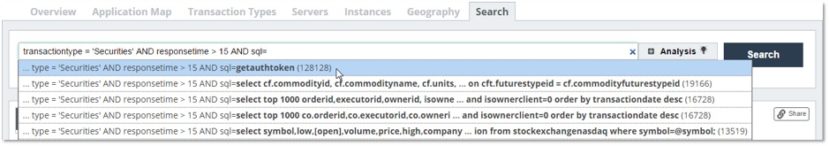
Two clicks to any answer
Using simple queries applied to transaction records with full user data, method, log and SQL detail, you can easily answer virtually any performance question with SteelCentral AppInternals. Metadata details are indexed across billions of transactions allowing you to quickly find the critical transaction or information you’re looking for, to generate reports, compare historical performance, or drill down for further analysis.
Business-relevant insight
One of the most handy capabilities in AppInternals is the ability to search for or define transaction types based on this really granular user metadata, and then pivot analysis on just those transactions.
For example, depending on the user data collected by the application, you could define a transaction type for millennials (a particular age group) searching for (a particular transaction function) wearable electronics (a type of product). You could even choose to make it even more specific. Perhaps your business is focused on moving the wearables inventory in the New York warehouse and, as a result, you care most about searches executed in the US Northeast region. You want to make sure these searches are lightning fast and that there are no errors or exceptions thrown. And you want to focus your IT team efforts on optimizing just those transactions based on business priority.
This is easily done in AppInternals by simply

- Searching for transactions that meet a specific set of criteria or
- Defining a transaction type based on those criteria and then selecting that transaction type in the user interface
All tables, graphs, maps and other visualizations will be updated to reflect only the set of transactions that meet the specified criteria.
Once you have transaction types defined, you can use the Prism graph to see the proportion of one type of transaction compared to another. This can be used for business funnel analysis but there are also other creative applications of this visual which I’ll explore in an upcoming blog.
Microservices—a massively multi-tier environment
Let’s consider a familiar visualization known as the application dependency map. For today’s massively multi-tier microservices-based applications, your basic n-tier architecture can now look like a thousand tiers, even for a single transaction. Here’s a typical dependency map for such an application. It is pretty much indecipherable.
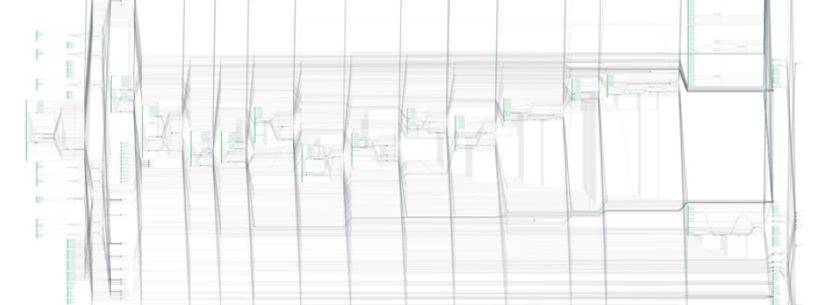
![]()

Performance Graph—a better way to visualize what’s really key.
To deal with this, you need a different way to visualize the dependencies. Performance Graph (shown above) abstracts away the intermediate tier dependencies in order to home in on information that is actionable and relevant to IT and the business, like:
- What are the most important business transactions, by volume and by financial value?
- What code components should my dev team focus on optimizing?
Most APM vendors construct aggregate application maps based on tier-pair data across sampled transactions and incomplete, snapshot-based traces. At best, these maps are decent approximations of the real environment, but at worst, they are grossly inaccurate and point to the wrong conclusions. With AppInternals, you can actually tease apart the end-to-end path of individual transactions or transaction types for a much more specific and reliable analysis based on business priorities.
How optimizing a 53 ms method saved 2,000 hours of processing time!
Here’s an example of how the right data and visualization can quickly identify the application optimization projects that have global impact across the application and the biggest overall impact on the business.
One of our engineers was working with a customer who had experienced degraded performance on the homepage on their revenue-generating website. Other APM solutions had been able to identify long running methods in the code, but optimizing those methods had only had a negligible impact on the overall performance of the page and the business-critical performance issues persisted.
Enter AppInternals.
Using Performance Graph, our engineer immediately surfaced a particular method that was individually taking only 53 ms. This rendered it invisible to other APM solutions that take a Top N approach, looking at only the longest running method calls, based on incomplete trace data. Nevertheless, this short method, as a whole, was showing up as the single biggest factor in performance for the slow homepage. Optimizing this one method improved overall server time on the back end from 1.1 s down to 62 ms—saving the customer 2000 hours a day in processing time across the 7 million transactions that were impacted.
Conclusion
Microservices-based architectures have sliced applications into distributed components to the extent that some of our customers are seeing a single transaction execute across over a thousand tiers. Modern APM needs to be able to trace across all those tiers—and across the wire—and a single analysis console needs to be able to process and stitch together all of those distributed traces. Riverbed is able to do this for tens of thousands of components with our hyperscale clustered architecture. As we’ve seen in this blog, a number of unique analyses then become possible leveraging this big data warehouse of complete end-to-end transaction traces, archived with full metadata detail.
In my next blog, I’ll be exploring how context matters for application log data and why you’re better off using APM tools for log-based performance analysis. Stay tuned!
In the meantime, to learn more about the AppInternals product, you can watch our on-demand webinar on Deep Dive on User-Centric APM, Big Data and AI or try it out for yourself by clicking the button below.