

Quantifying Cloud Security Effectiveness
So now we have security tools in place to secure our cloud assets in SaaS, PaaS and IaaS. The next step is to determine what security controls need to be implemented. What DLP policies should the agency adopt? What capabilities of a cloud services should be enabled or disabled to maintain a robust security posture? How does an agency actually go about measuring the effectiveness of the security controls that were implemented? How do we find out how we stack up against our peer organizations?

Let’s start with the good news. Agencies are adopting cloud services at an increased rate. Adoption has only increased in times of coronavirus quarantine lockdowns with most federal, state and municipal workforce working from home. What’s even better news is that we also see increased adoption of cloud security tools, like CASB, which is commensurate with the expanding cloud footprint of US Public Sector agencies.
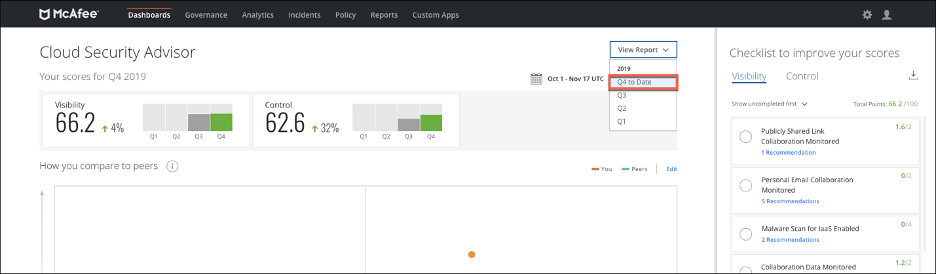
When you first access Cloud Security Advisor dashboard you are presented with a “magic quadrant” that shows your organization’s security posture relative to other peer organizations on the scales of Control and Visibility and provides a maturity score for both.
To answer these questions, McAfee developed MVISION Cloud Security Advisor (CSA). Cloud Security Advisor is a portal that is provided “out-of-the-box” with your organization’s MVISION Cloud CASB tenant. CSA provides a comprehensive set of recommendations for organizations to prioritize efforts in implementing their cloud security controls. The recommendations are broken down into Visibility and Control metrics. There is also a section that provides quarterly reports on various parameters, which we will discuss in a little bit.
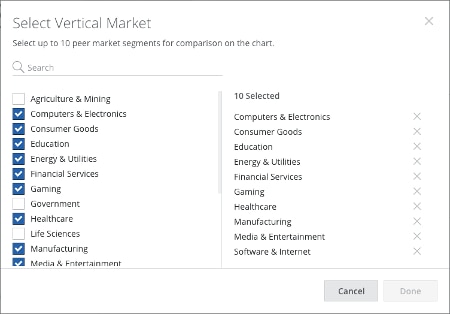
There is even an option to select a vertical market to see how your organizations stacks up to organizations in other business sectors.
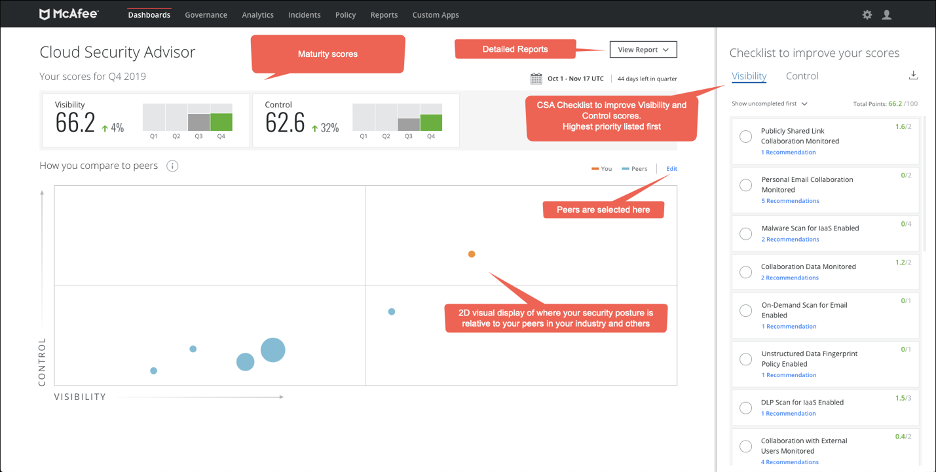
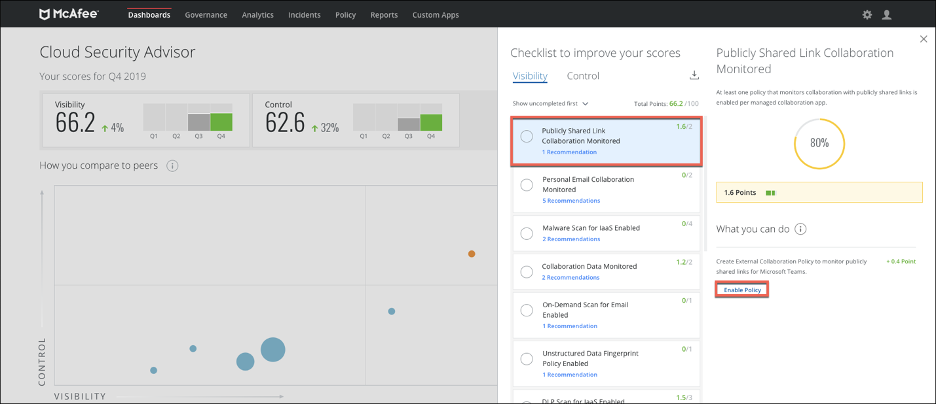
On the right of the main dashboard are check list items that provide a short description and current progress in following Cloud Security Advisor’s recommendations. CSA scans the organization’s MISION Cloud environment once every 24 hours. Any changes to MVISION Cloud will be reflected in the next scan. In the screenshot below, for example, we see an environment that is not enforcing controls on publicly shared links in Collaboration SaaS apps.
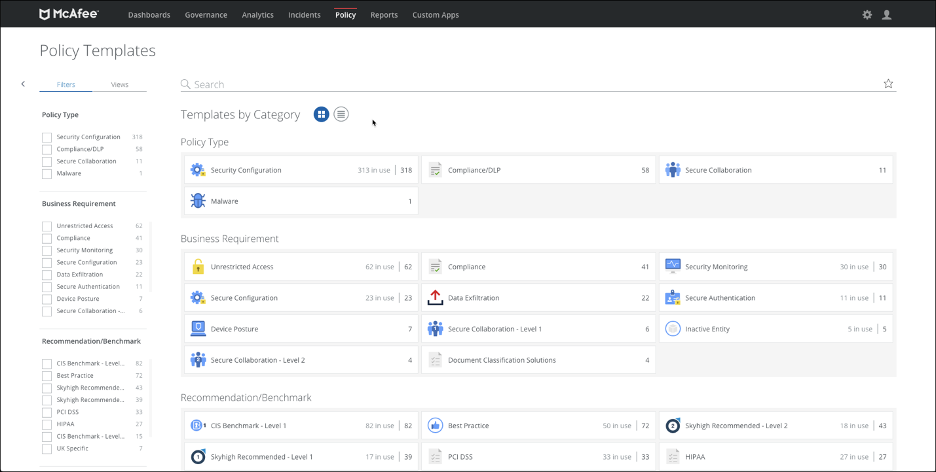
From here, a security admin can simply click on the check list item and then on Enable Policy. This will automatically take the user to the DLP Policy Templates page to select the appropriate policy for enforcement.
Another powerful capability of MVISION Cloud Security Advisor is providing quarterly Cloud Security Reports. These are accessible from the main CSA dashboard by going to View Reports and then selecting a quarter for which you would like to see the report.
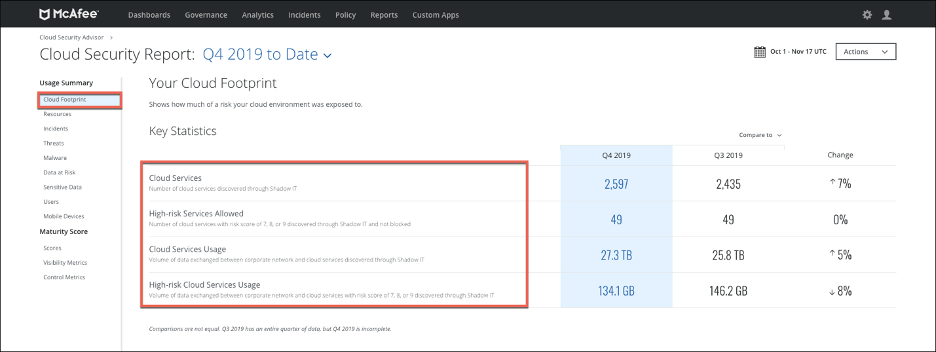
From there we can start examining our organization’s cloud footprint to identify total number of Shadow IT services discovered that quarter as well as some additional Shadow IT statistics.
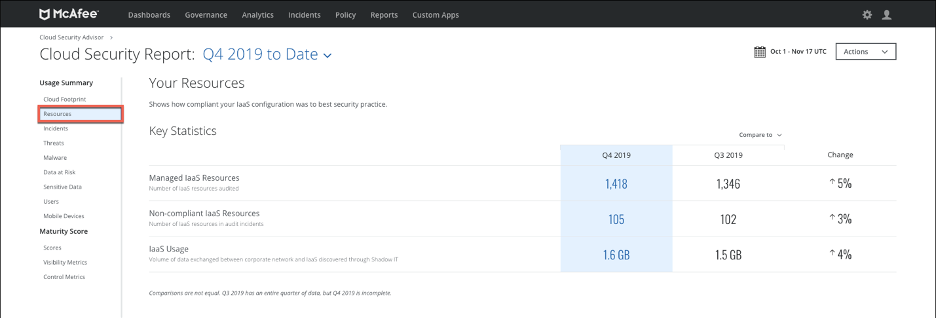
Next we can look at IaaS resources in all our AWS, Azure and GCP environments.
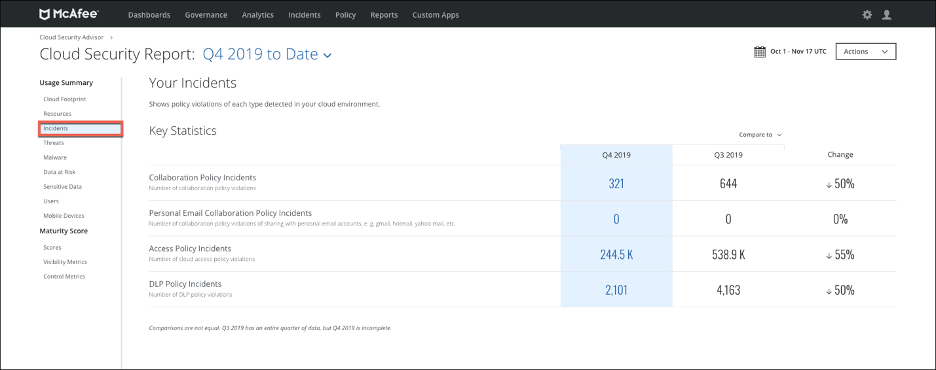
We then proceed to look at summary statistics for DLP and access policy violations. Incidents show policy violations of each type detected across all of the organization’s cloud environments secured by MVISION Cloud CASB.
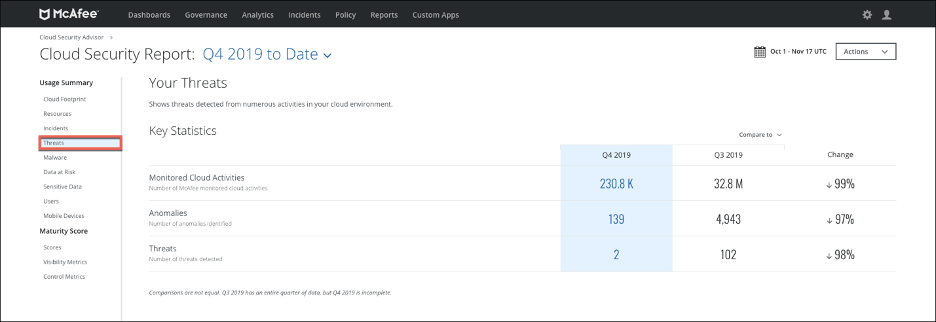
Next screen shows user behavioral anomalies and threats uncovered by MVISION Cloud UBA machine-learning engine.
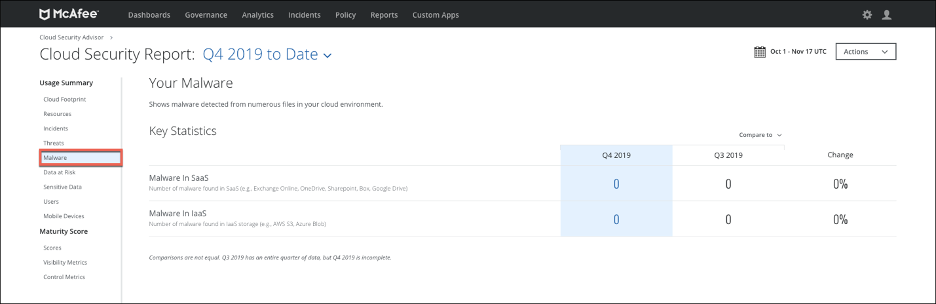
The Malware section of the report provides insights into malware uncovered in SaaS and IaaS environments connected to MVISION Cloud.
The Data at Risk report is probably the most pertinent to gauging the effectiveness of the MVISION Cloud CASB solution. This report shows how much of the organization’s data was at risk and how it was secured using MVISION Cloud CASB. As seen from the image, there is a downward trend, indicating progress is being made to secure organization’s data. 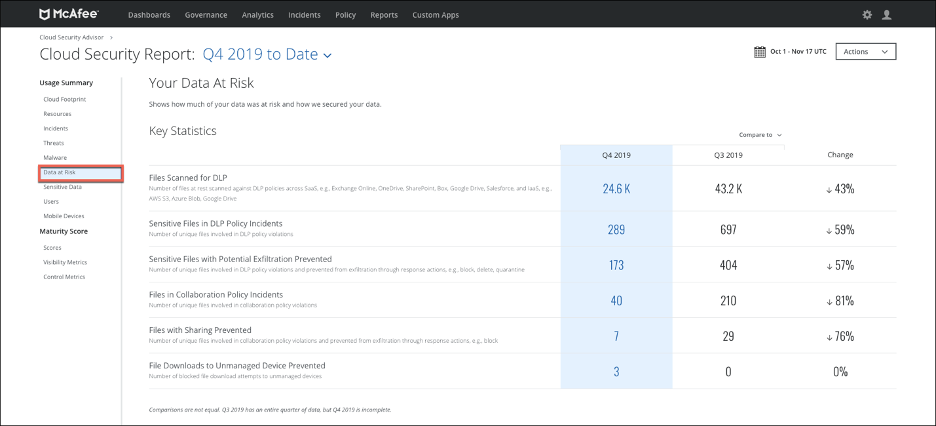
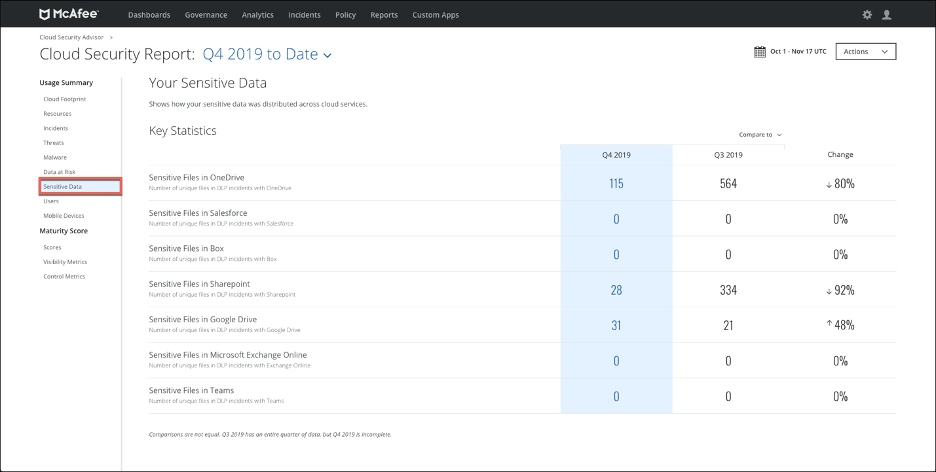
The Sensitive Data report shows how organization’s sensitive data is distributed across all cloud services in use by the organization. This report also provides insights into cloud adoption trends for your organization.
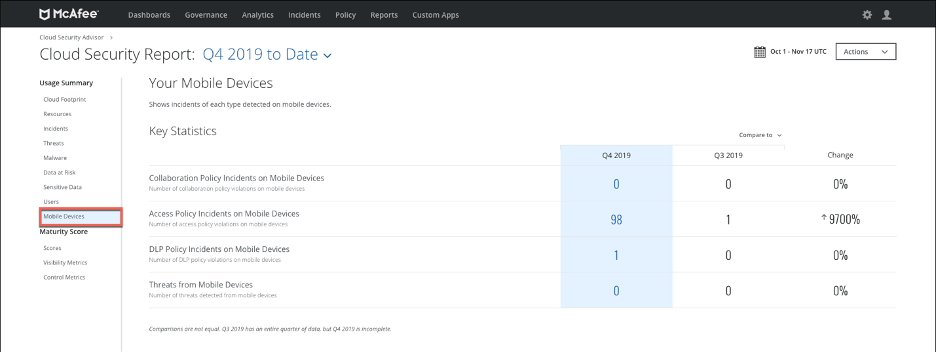
The Mobile Devices report shows incidents for each type of detected mobile device.
The “Users” report is a pivot table of the Sensitive Data report that organizes incidents and policy violations by individual users. Ultimately, the report shows how much of a risk an organization’s users pose to organization’s data. 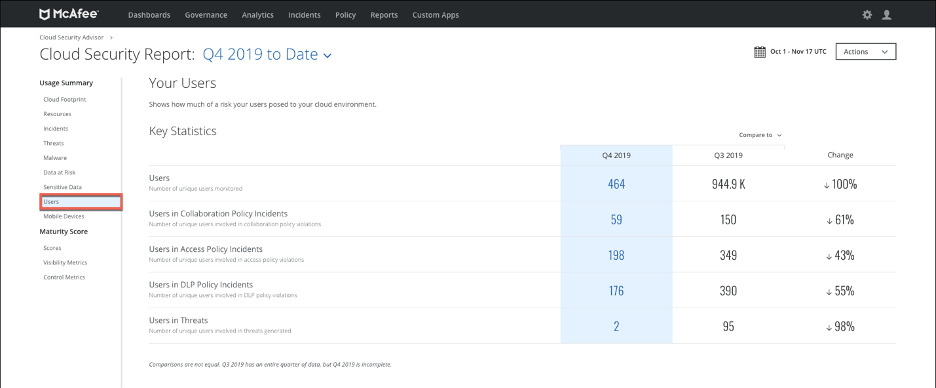
The next three pages of the CSA report provide a deeper dive into the data on the front page of the CSA portal we saw in the beginning of this blog. On the Scores page we see the “magic quadrant” with Control and Visibility axis, together with progress relative to previous quarters. Visibility score and Control score, both on a scale of 100, gauge your organization’s maturity in securing its cloud footprint. 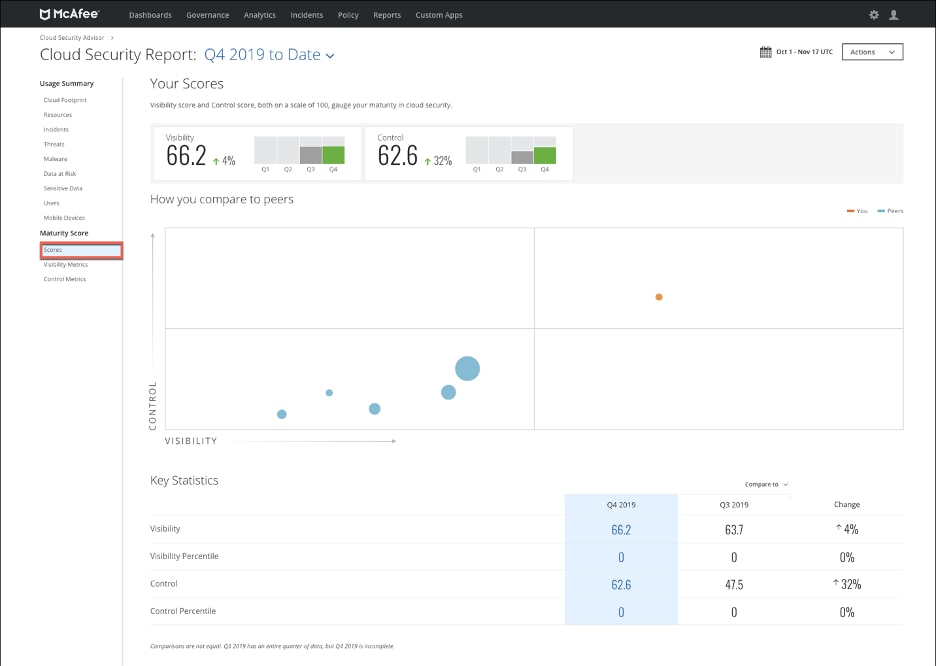
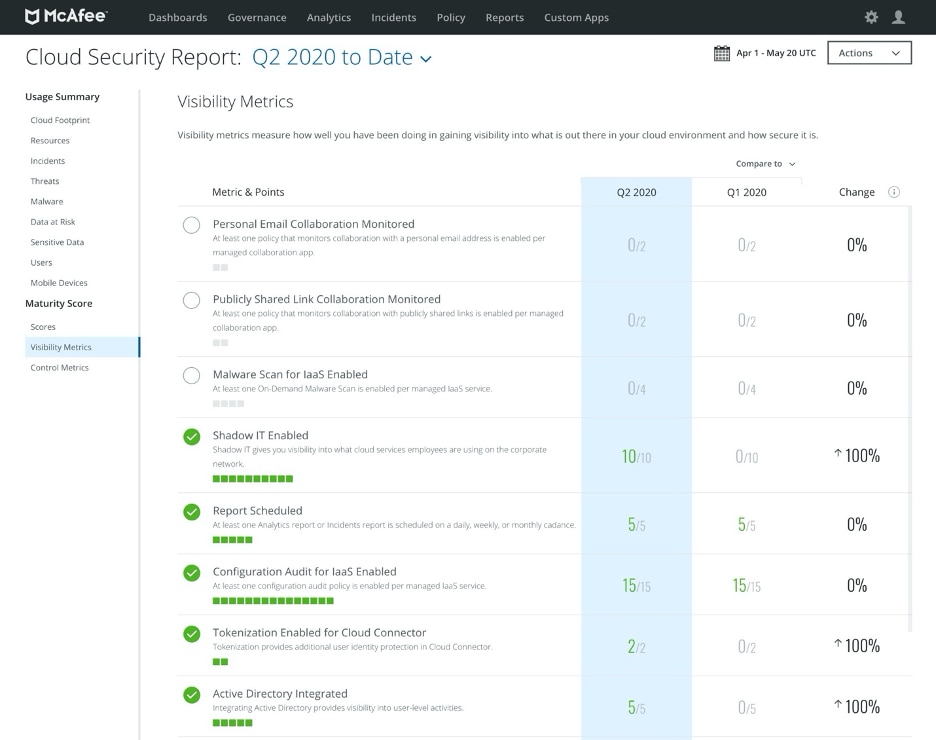
Next, the Visibility metrics page. Visibility metrics measure how well an organization has been doing in gaining visibility into what is out there in their cloud environment and how secure it is.
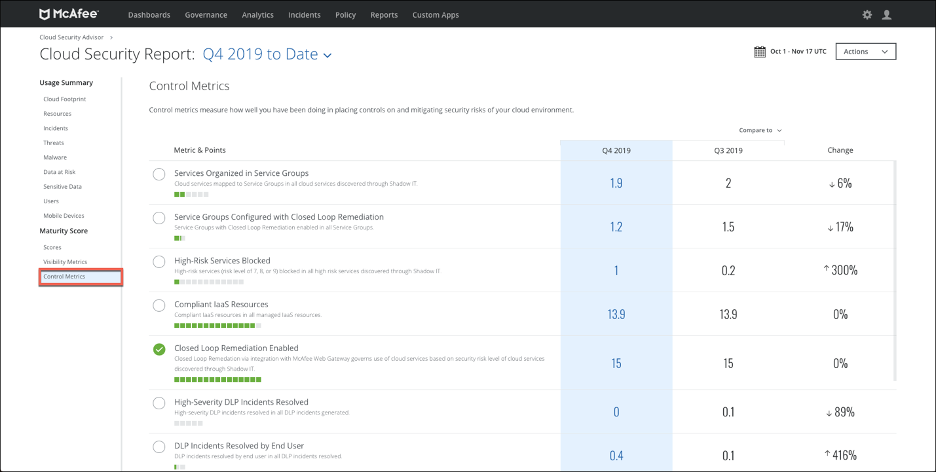
Finally, the Control metrics page shows how well an organization has performed in placing controls and mitigating security risks for its cloud environment.
To see MVISION Cloud Security Advisor in action, please check out the video below:
And that, in a nutshell, is it. By reviewing the screenshots from the Cloud Security Advisor dashboard you should now have a good idea of the metrics at your disposal to quantify cloud security effectiveness for your organization.
This post was first first published on Enterprise – McAfee Blogs’s website by Andrey Zhuk. You can view it by clicking here