

Implement Risk-Based Vulnerability Management with Qualys TruRisk™ : Part 2
This blog is a continuation of our first blog on implementing risk-based vulnerability management with Qualys TruRiskTM. In the first blog, we covered how to correctly tag and categorize assets for accurate risk assessment. Now that you have properly tagged your assets, Qualys TruRiskTM will automatically assess their risk across your organization. In this blog, we will show you how to visualize and measure this risk.
Read the Operationalizing Qualys VMDR With Qualys TruRisk™ – Part 1
Create Risk Score Widgets to Track Qualys TruRiskTM
The best way to visualize risk across the organization is by leveraging Qualys Unified Dashboard and TruRiskTM Score widgets. TruRiskTM Score widgets help organizations quickly quantify risk across the infrastructure, assess high-risk assets, take actions to reduce risk, and track risk reduction over time.
Let’s take a few examples of the widgets.
- Assess TruRiskTM for External assets
Create a widget with QQLtags.name:Shodan or tags.name:external or tags.name:EASMenable trending and contributing factors
You can further slice these numbers based on geographic location, business units to quickly assess the risk to prioritize remediation efforts
- View TruRiskTM Score based on Tags
Create a Table widget using QQLtags.name:agentand add multi-grouped of Tags and TruRiskTM
- Create High Value vs High-Risk Asset widgets
You can see, out of critical assets how many have the critical risk score. The Venn widgets provide you with a good view at a glance.
- Top vulnerabilities to prioritize
We recommend organizations prioritize critical vulnerabilities on high-value assets first.
Following QQL will help identify those vulnerabilities in Asset Query –criticalityScore>=4 or riskScore>=700 and in Vulnerability Query – vulnerabilities.detectionScore>90 and vulnerabilities.typeDetected:confirmed
There are different sets of widgets you can create to make your dashboard more effective which provides you with a complete track of the risk across your organization.
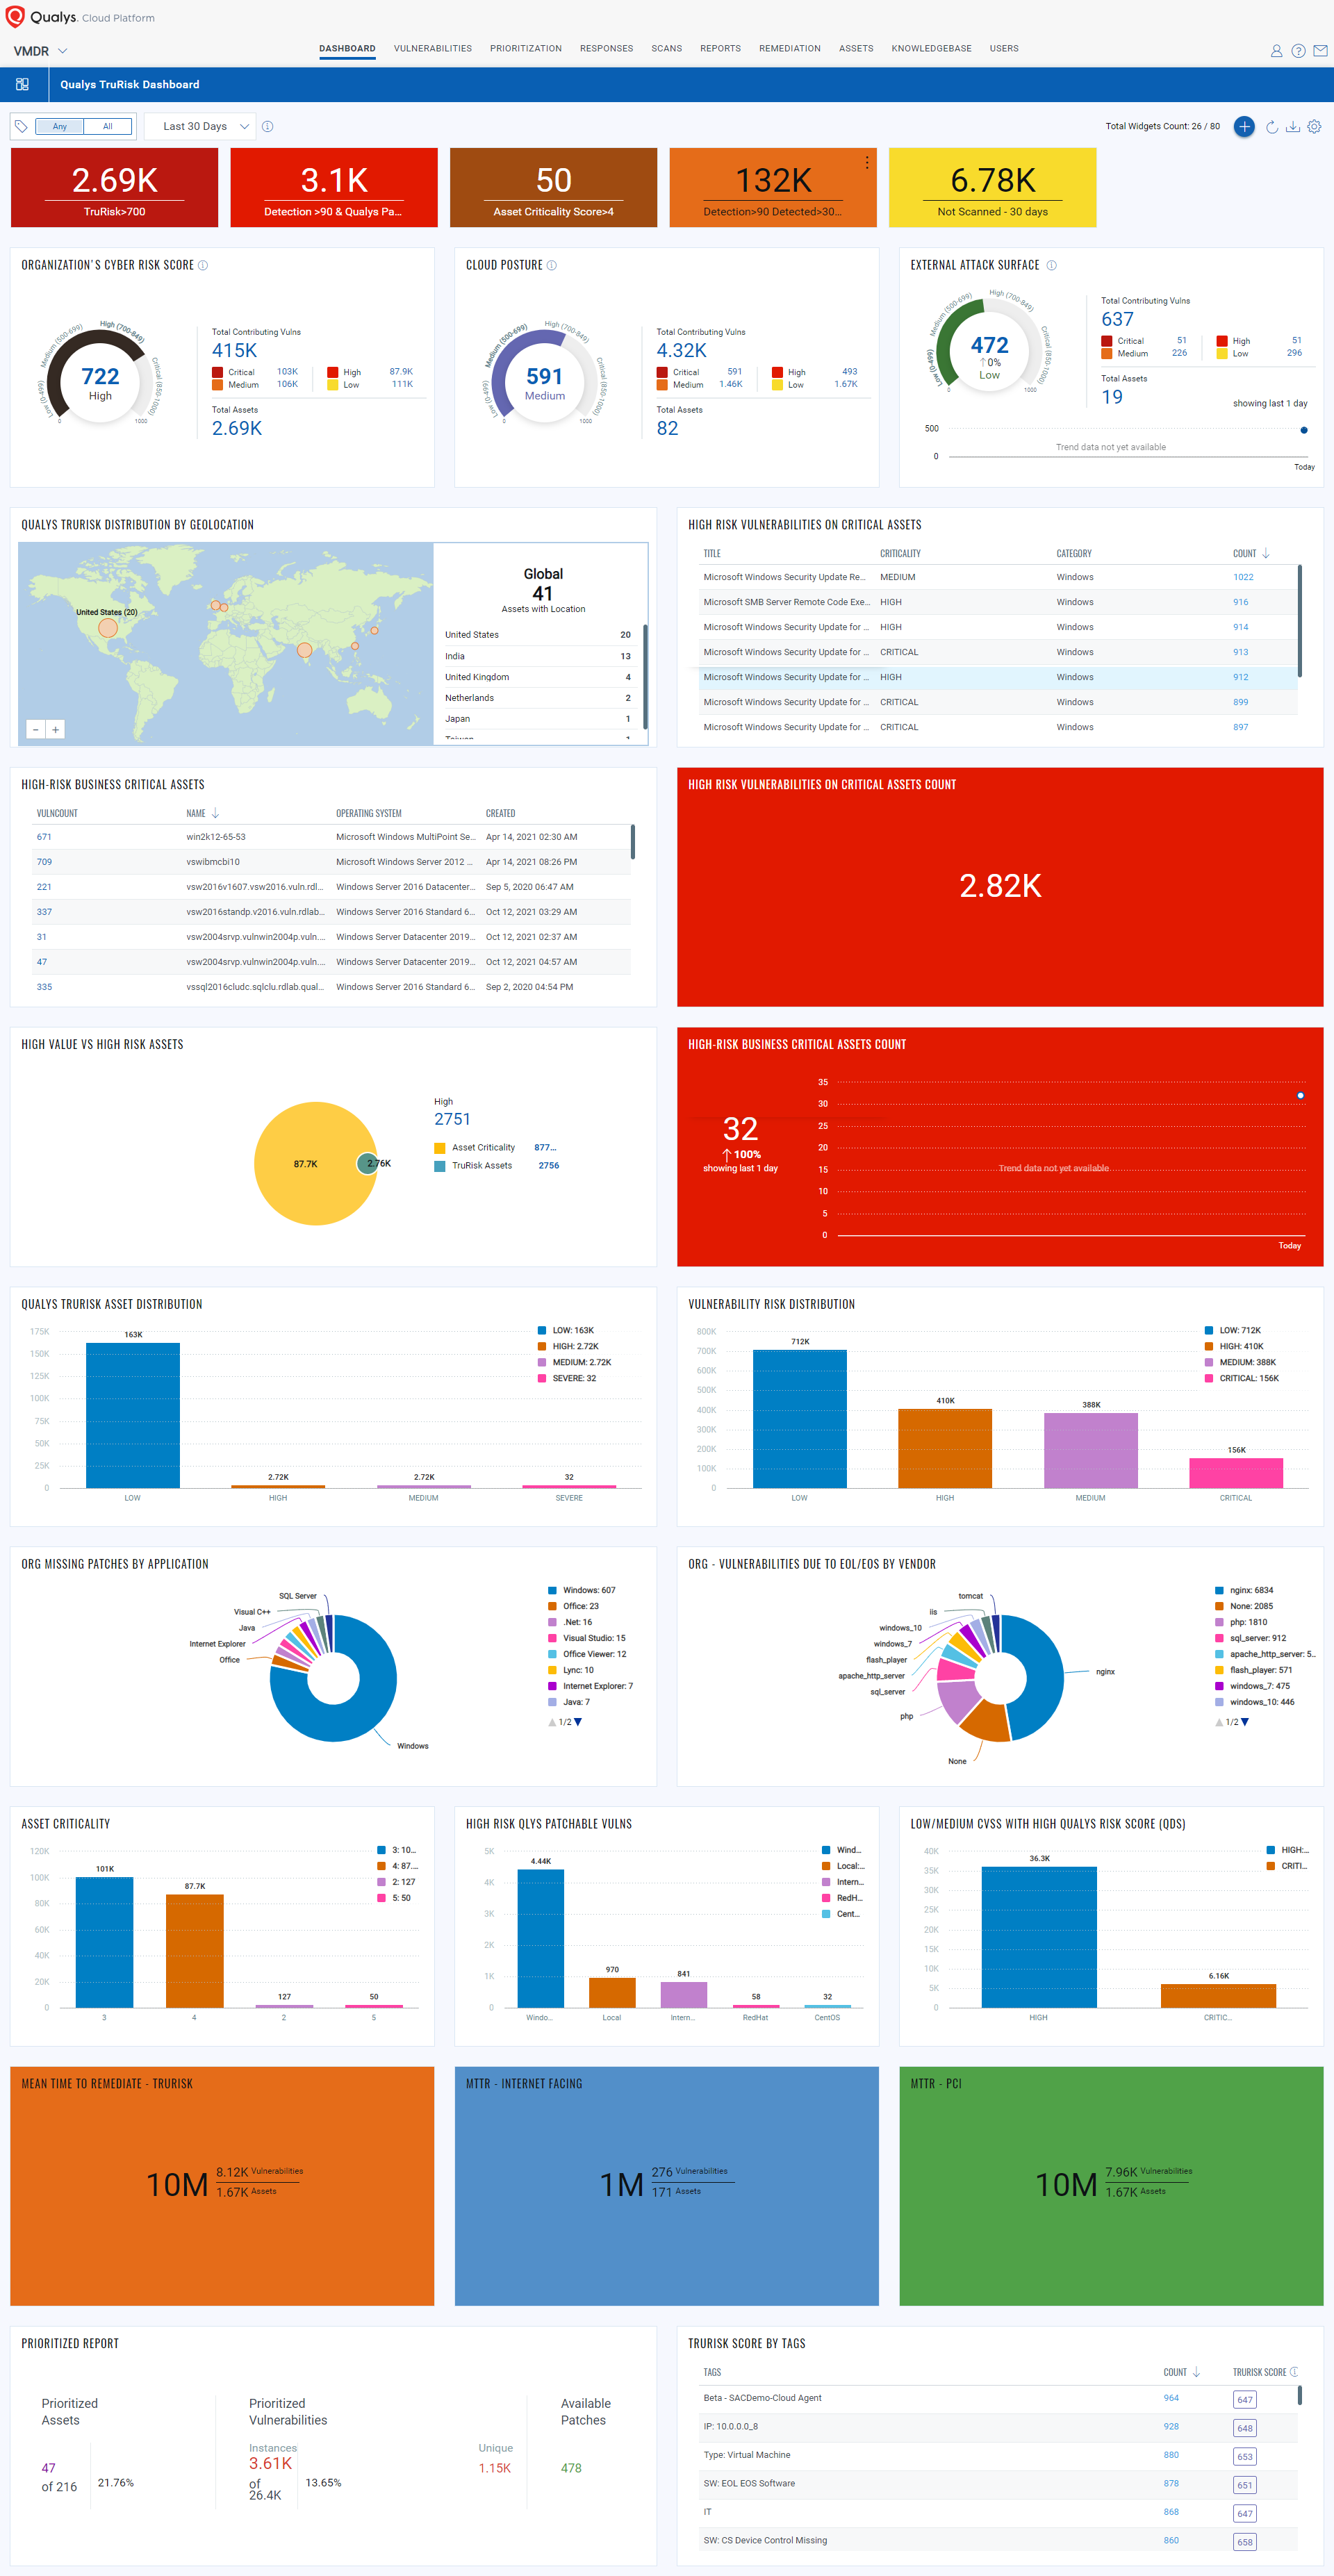
Visualize and Measure Risk with Unified Dashboard
The below dashboard provides you with the complete Organizational level security posture in a single pane of glass. You can download the JSON of the below dashboard from here. Download and import the JSON file in your subscription to create the dashboard template and you are ready to track the organization-level risk posture with Qualys TruRiskTM.
Interpreting Qualys TruRiskTM Scores
Qualys VMDR with Qualys TruRiskTM is powered by one of the most comprehensive exploits and threat intelligence databases. It spans over 185k CVEs, and 25+ unique threat and exploits intelligence sources such as Metasploit, Canvas, CISA KEV, and even GitHub, which is increasingly becoming the go-to place to publish exploits.
Qualys TruRiskTM builds the vulnerability risk profile of vulnerabilities, assets, and asset groups by using the following three risk scores:
Qualys Vulnerability Score (QVS) – QVS is assessed at each CVE level based on the external threat and exploit intelligence factors listed above. It is also computed for vulnerabilities that don’t have Qualys vulnerability detection signatures (QIDs). These QVS scores can be individually queried for insights from our dedicated API endpoint.
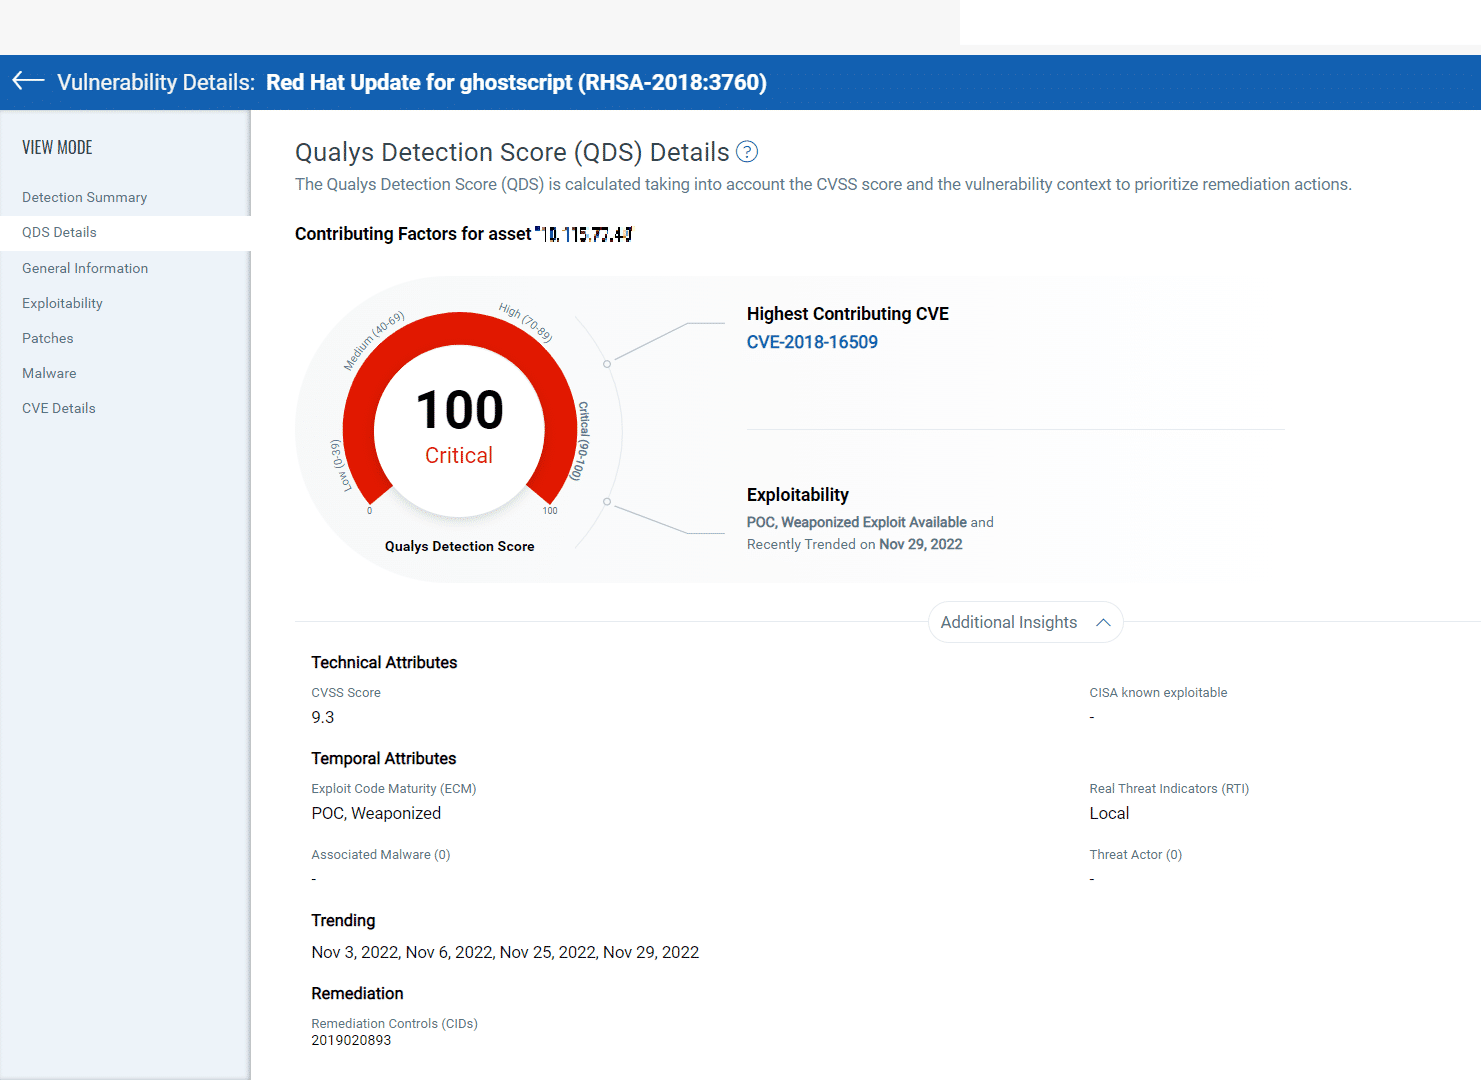
Qualys Detection Score (QDS) – QDS is assessed at each QID level. This is the score customers need to focus on for their vulnerability prioritization needs. QDS builds on the QVS score by adding two key aspects. Some QIDs can be mapped to multiple CVEs. QDS selects the highest QVS of all associated CVEs to that QID. Next, QDS accounts for any compensating/mitigation controls that are applied to an asset to reduce the risk score for a given vulnerability. For example, QDS will reduce the risk of a Remote Desktop Protocol (RDP) vulnerability if RDP is disabled.
| QDS/QVS Range | Description |
| >=95 | CVSS critical, exploited in the wild, has weaponized exploit available, trending risk on social media, and the dark web. |
| 90-95 | CVSS critical, weaponized exploit available, and evidence of exploitation by malware, threat actors/ransomware groups |
| 80-89 | CVSS Critical, weaponized exploit available, but no evidence of exploitation.
CVSS Critical with evidence of exploitation, but mitigation in place. |
| 70-79 | CVSS High, weaponized exploit available, but no evidence of exploitation |
| 60-69 | CVSS critical, no exploits available |
| 50-60 | CVSS High, a Proof of Concept (PoC) exploit is available |
| 40-50 | CVSS High, no exploit available |
| 30-39 | CVSS Medium, a PoC exploit is available |
| 1-30 | CVSS Low vulnerabilities, low risk of exploitation |
Qualys TruRiskTM Score of an Asset
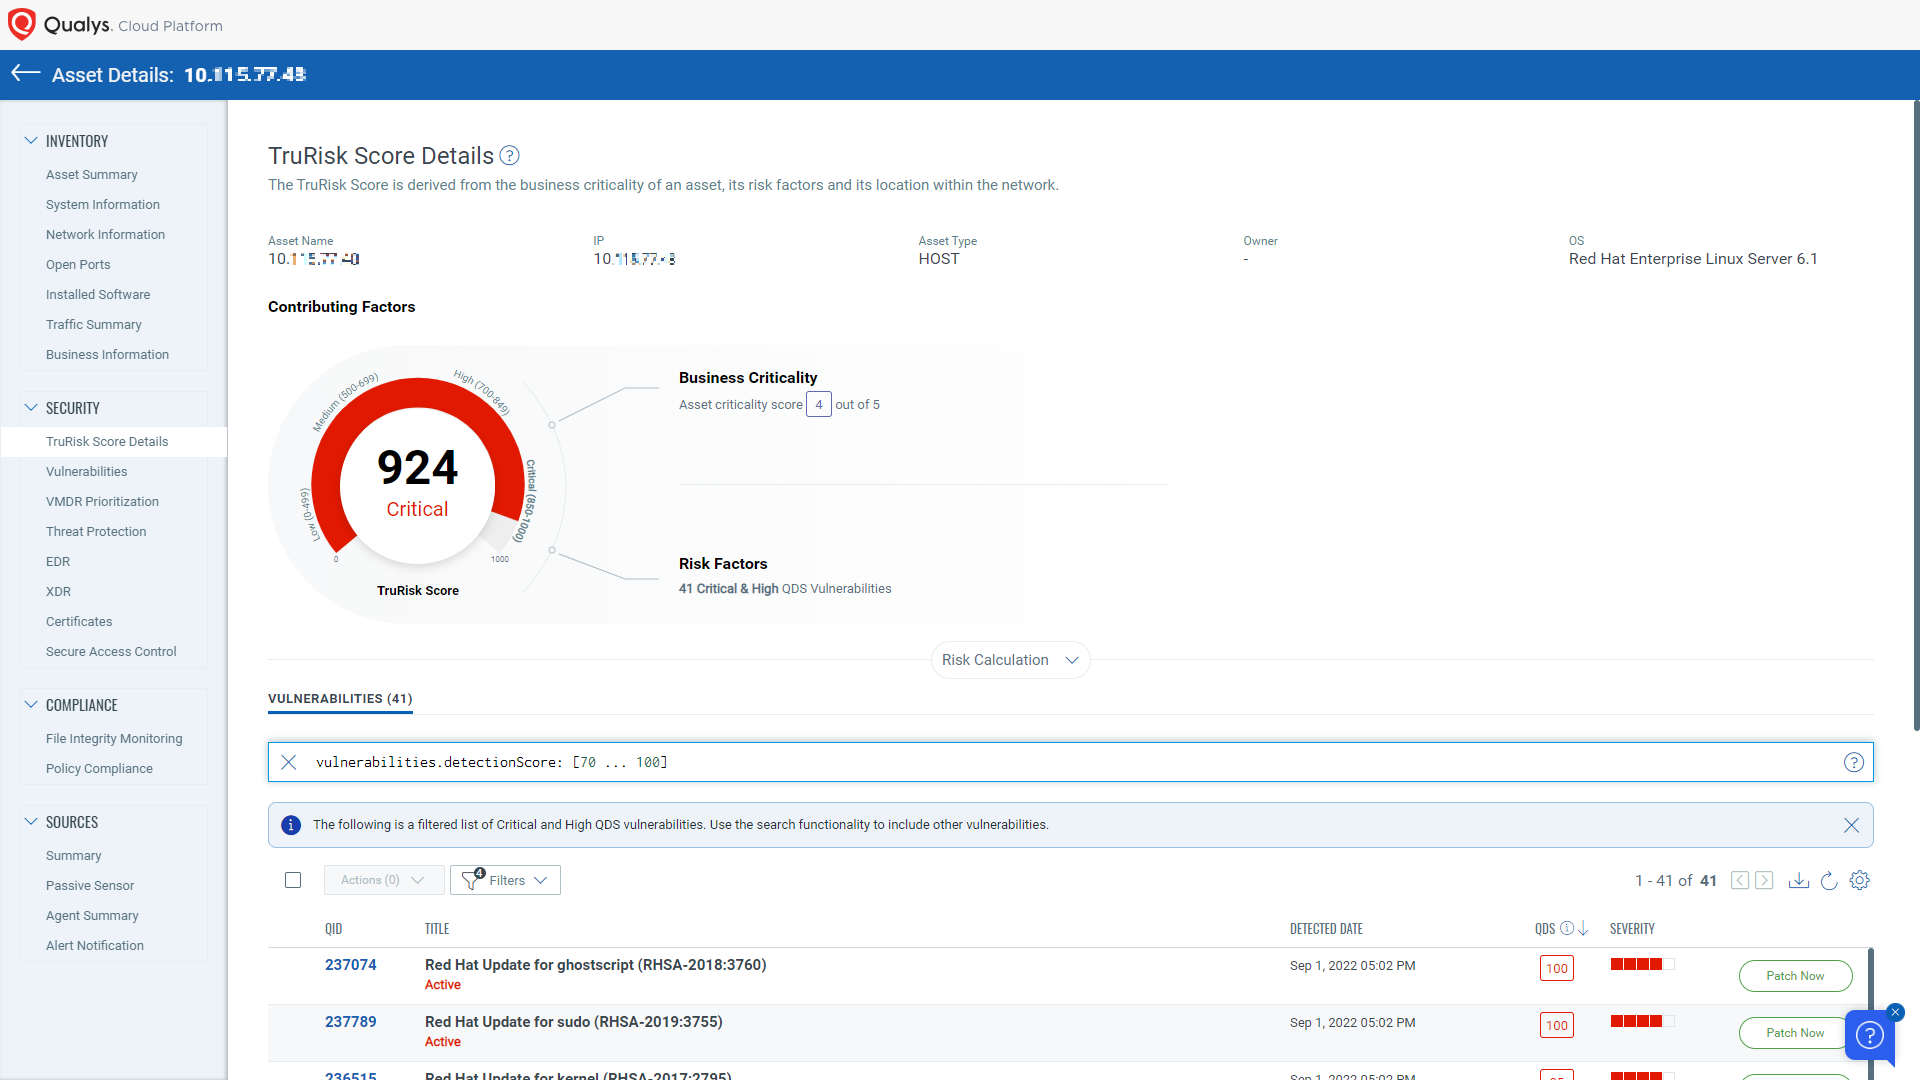
Qualys TruRiskTM is next type of risk score allows organizations to identify the riskiest assets in their organization. To assess the risk an asset poses to an organization, the Qualys TruRiskTMscore of an asset considers multiple factors.
The primary factor considered by the Qualys TruRiskTM score of an asset is Asset Criticality, i.e, what risk the asset poses based on its business value. For example: Is the asset part of a production system, a system hosting a production database, or is it purely an internal system used for development and test purposes? Production assets should be rated higher than test systems.
Qualys TruRiskTM determines the business criticality of the asset using multiple approaches, including:
Manual Ratings – Qualys TruRiskTM allows users to set the criticality of the system by using asset tags
Synchronization with CMDB – Most enterprises store business criticality information for assets in a configuration management database. Qualys automatically maps to CMDB data to determine the criticality of the system
APIs – Using Qualys APIs for Asset Management and Tagging, users can assign business criticality to an asset . Finally, Qualys TruRiskTM analyzes the vulnerabilities found on the system and determines the asset’s risk based on the QDS scores of the vulnerabilities on an asset by a clearly defined formula called the Asset Risk Score formula.
Asset Risk Score Formula
The Qualys TruRiskTM Score is calculated using the following formula:
TruRiskTM Score = ACS Score * [wc * Avg (QDS for Critical Vuln) * f (Critical vuln count) +wh * Avg (QDS for High Vuln) * f (High vuln count) +wh * Avg (QDS for Medium Vuln) * f (Medium vuln count) +wh * Avg (QDS for Low Vuln) * f (Low vuln count)] * I(External)
In the above formula, ACS is Asset Criticality Score, w_are the weights fine-tuned by Qualys TruRiskTM algorithm to multiply each of the severity, function f (), is a non-linear function that increases exponentially as the number of vulnerabilities increases. Also, factor I(External) is for the case where an asset is external facing or discoverable by Shodan. This factor increases the score appropriately for external-facing assets.
| TruRiskTMRange | Severity | Description |
| 850-1000 | Critical | Critical assets with multiple critical or high vulnerabilities |
| 700-849 | High | High-value asset with multiple number of critical or high vulnerabilities or is exposed to the internet |
| 500-699 | Medium | Moderate-value assets with critical or high vulnerabilities |
| 0-499 | Low | Low-value asset with multiple vulnerabilities |
Read the “In-Depth Look Into Data-Driven Science Behind Qualys TruRisk” blog for more details.
Prioritization based on the Qualys TruRiskTM
Qualys VMDR prioritization helps you prioritize and deploy patches for high-risk vulnerabilities by providing a risk-based view and defaulting to High and Severe TruRiskTM score assets. To create a prioritization report, select the appropriate tags and enable the “Qualys TruRiskTM Mode” toggle. You can prioritize based on asset criticality, Qualys detection score, and Qualys TruRiskTM score, with the default settings being High asset criticality, Critical detection score, and High and Severe TruRiskTM scores. Click “Prioritize” to view the prioritized vulnerabilities and patch details, and use the separate tab to view patchable vulnerabilities and manage patch deployment with Qualys Patch Management. This helps reduce MTTR by identifying missing patches on critical assets.
That wraps up our second blog of the series.
To conclude, the use of Qualys TruRiskTM allows organizations to effectively visualize and measure risk in their environment. These insights can help them make informed decisions and take action to reduce our risk through automated remediation. In the next part of this series, we will explore how to use these insights to implement effective risk-based remediation strategies. Stay tuned!
Start your free trial of Qualys VMDR with Qualys TruRiskTM
This post was first first published on Qualys Security Blog’ website by Swapnil Ahirrao. You can view it by clicking here