

Micro Focus Consulting. Professional. Service.
I am Dr. James D. Borderick, and I look after the Competitive Benchmark research for Micro Focus, which I have been doing for over five years. I wish to share some very interesting statistics with our followers regarding satisfaction with Consulting.
How do we Measure Consulting?
Micro Focus uses double-blind competitive benchmarking to gauge how well we are doing against the competition. This strategy means we can understand how we are performing with a high degree of statistical accuracy using a highly repeatable and scientific method. There are several customer lifecycle touchpoints and brand image attributes that are tracked, and Consulting is one of them.
What is Consulting?
Consulting / Professional Services Engagements has an industry definition of “Overall experience with their consulting/professional services organization to implement, upgrade, fix and/or optimize your software.” The business reasoning behind great Consulting is that it can contribute to brand loyalty and repeat sales; happier customers tend to create repeat customers. Good Consulting can result in positive word-of-mouth for a company. Poor Consulting can prevent companies from achieving a good customer satisfaction.
What is the Relative Impact of Consulting on Net Promoter®?
Micro Focus, via Competitive Benchmarking, also know that the Consulting touchpoint provides 6.4% of the relative impact on Net Promoter® or the relationship metric. This is important to realise since all touchpoints contribute in some way to the overall ‘relationship’ metric with a company, and thus, using the right metric at the right time is not only important, but necessary (but that’s a topic for another time).
So how is Micro Focus performing against the competition in Consulting?
Micro Focus Consulting Performance Against the Competition
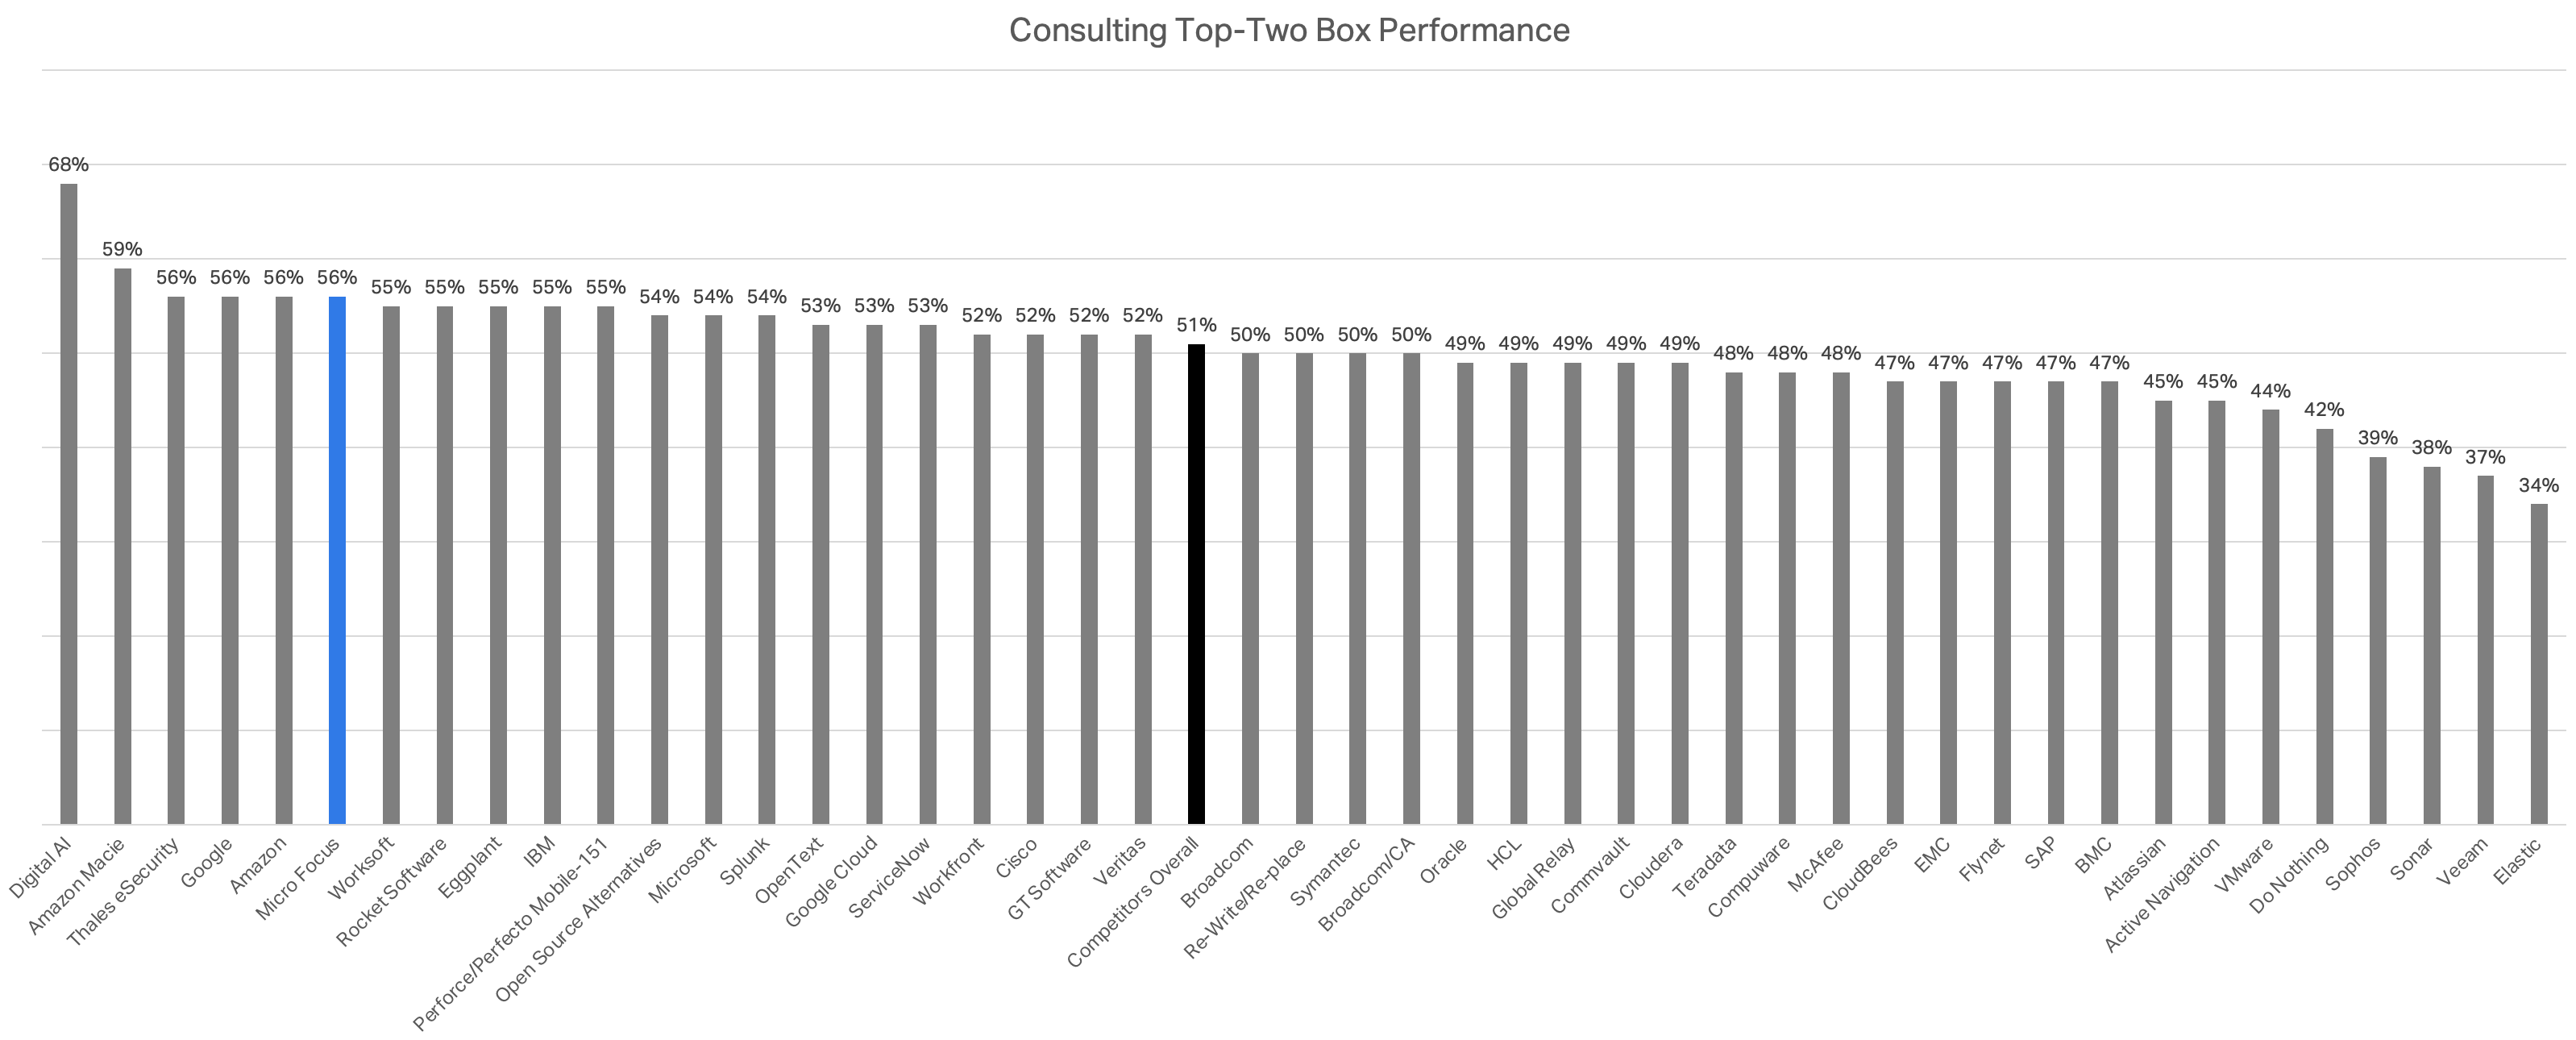
The figure above presents the latest Consulting top-two box satisfaction for each brand* at the worldwide level in software. This percentage shows the number of customers responding with the top scores. A way of interpreting this for a value of 50%, then 1 in 2 of customers liked the Consulting and 1 in 2 didn’t like it. Generally, then all software companies are not that great at Consulting (average is 51% top-two box satisfaction) and so for Micro Focus to be 6th in the software industry is a great feat indeed. Micro Focus Consulting is 5% better than the average competitor and is 6th out of all competitors with a top-two box satisfaction of 56%. When we compare against some of our competitors, we see that we are 1% better than IBM, 2% better than Microsoft, 2% better than Splunk, 3% better than ServiceNow, 3% better than Google Cloud, and 7% better than Oracle.
*Sample Size Worldwide: n=15,798, Micro Focus n=1,278, and all competitors n=14,520.
Why is the Competitive Benchmark industry defensible?
We do not know who the respondents are, and they themselves do not know that Micro Focus is sponsoring the study, thus this study has a dramatically lower bias than other surveys. We can safely say that the data analytics is performed at the 90% Confidence Level, which is unheard of in the industry. This means if any of our competitors performed the same study, they would have the same results. Couple these points with a data sample size of over 15,000 respondents per rolling quarter and we have a Benchmark that truly is industry defensible.
Don’t hesitate to contact me on Twitter to talk directly if you’d like, especially if you have suggestions for how the teams at Micro Focus could improve their Consulting further!
This post was first first published on Home | Micro Focus Blog website by DrBorderick. You can view it by clicking here