

Micro Focus is A1 for Ease of Doing Business with…helping to rock the Net Promoter®
How do we Measure easy to do business with?
Micro Focus uses double-blind competitive benchmarking in order to gauge how well we are doing against the competition. This strategy means we can understand how we are performing with a high degree of statistical accuracy using a highly repeatable and scientific method. There are a number of customer lifecycle touchpoints and brand image attributes that are tracked, and ‘easy to do business with’ is one of them.
How important as a brand image attribute is ease of doing business?
Micro Focus, via Competitive Benchmarking and driver modelling, also knows that ‘ease of doing business with’ is one of the most important brand image attributes. This is important to realise since all touchpoints and brand image attributes contribute in some way to the overall ‘relationship’ metric with a company, and thus, using the right metric at the right time is not only important, but necessary (but that’s a topic for another time).
So how are Micro Focus performing against the competition in ‘easy to do business’?
Micro Focus ‘Easy to do business’ Performance Against the Competition:
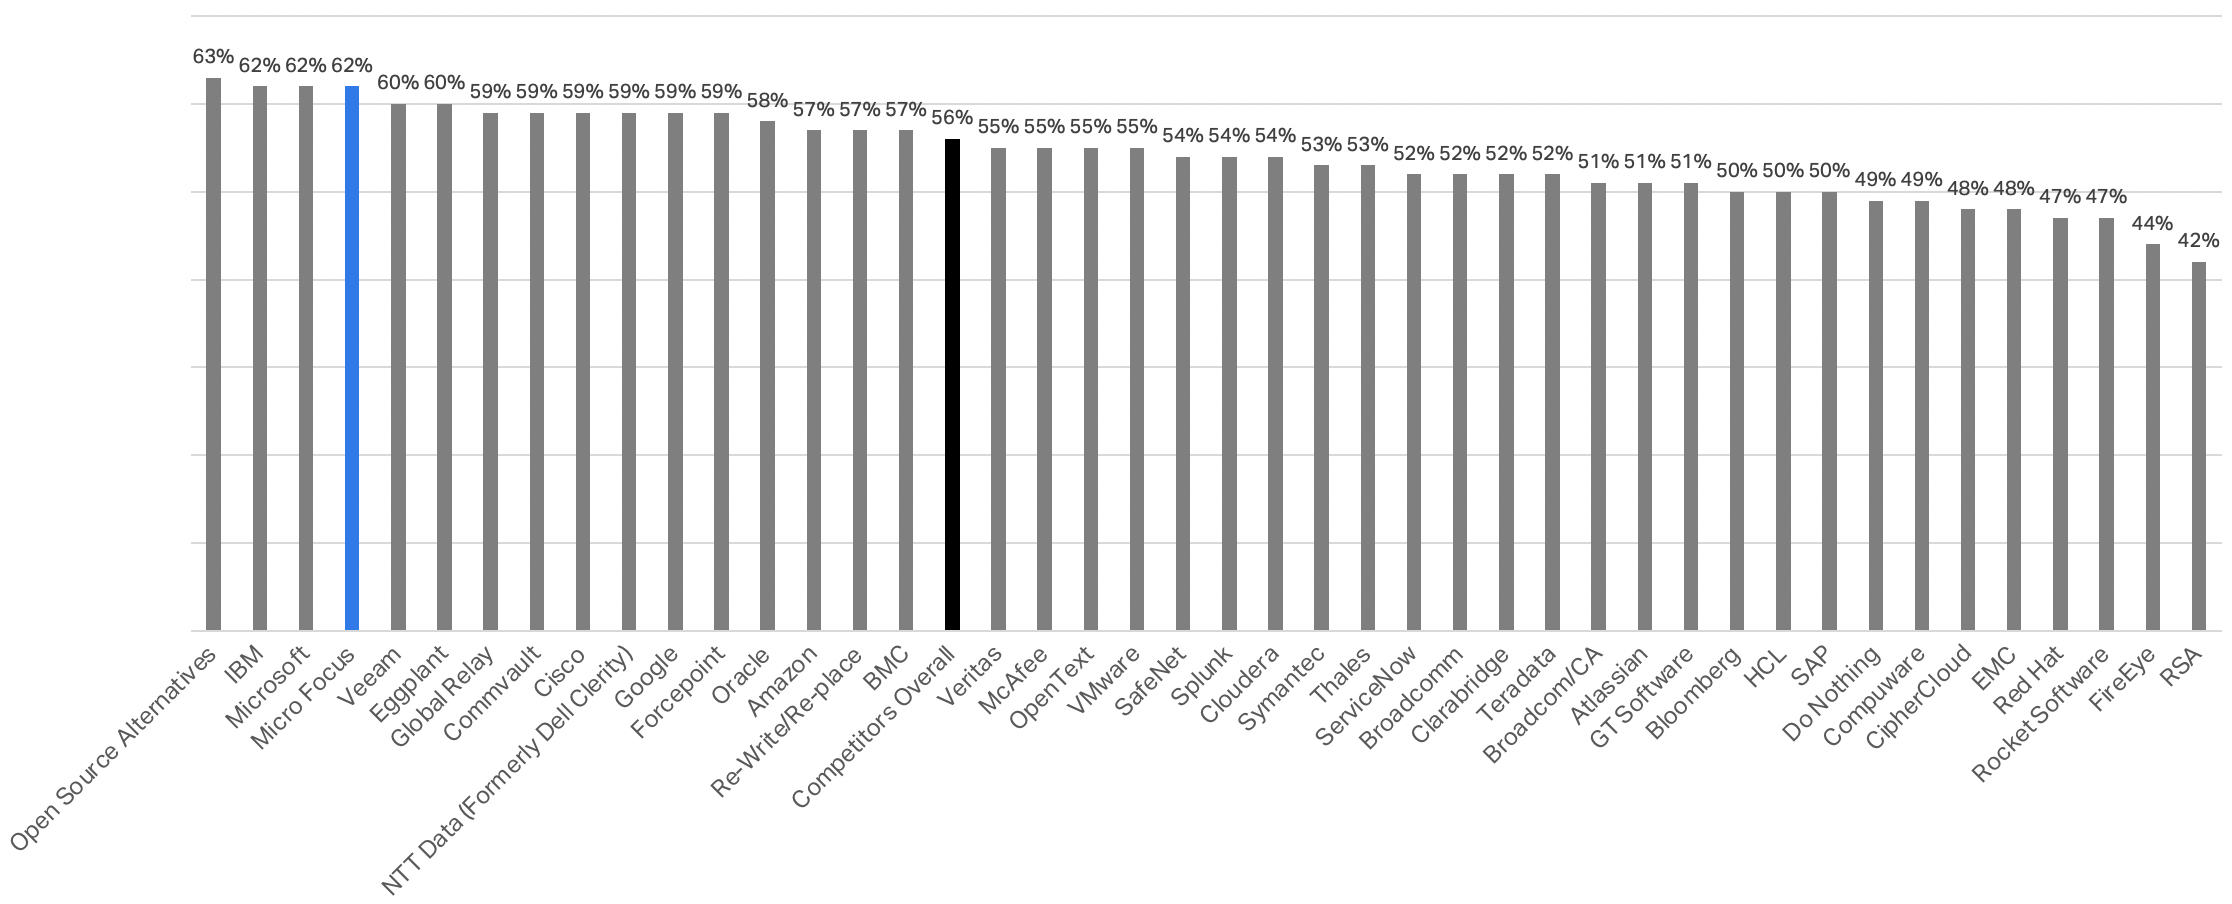
n=15,169 | Micro Focus n=1,710 | All Competitors n=13,459
The figure above presents the ease of doing business top-two box satisfaction for each brand at the worldwide level in software. This percentage shows the number of customers responding with the top scores. A way of interpreting this is if there is a value of 50%, then 1 in 2 of customers thought they were easy to do business with and 1 in 2 didn’t. Generally, then all software companies are not that easy to do business with and so for Micro Focus to be fourth in the industry this is a great feat indeed. Micro Focus is ranked 6% better than the average competitor in the industry and is 4th out of all competitors with a top-two box satisfaction of 62%. When we compare against some of our competitors, we see that for ease of doing business with, we are ranked level with IBM (on 62%), 2% better than Veeam, 3% better than Google, 4% better than Oracle, 8% better than Splunk and 10% better than ServiceNow.
Why is the Competitive Benchmark industry defensible?
We do not know who the respondents are, and they themselves do not know that Micro Focus is sponsoring the study, and thus, this study has a dramatically lower bias than other surveys. We can safely say that the data analytics is performed at the 90% Confidence Level, which is unheard of in the industry. This means if any of our competitors performed the same study, they would have the same results. Couple these points with a data sample size of over 15,000 respondents per rolling quarter and we have a Benchmark that truly is industry defensible.
Don’t hesitate to contact me on Twitter to talk directly if you’d like.
This post was first first published on Home | Micro Focus Blog website by DrBorderick. You can view it by clicking here