

Thinking Outside the Bochs: Code Grafting to Unpack Malware in Emulation
This blog post continues the FLARE script series with a discussion of
patching IDA Pro database files (IDBs) to interactively emulate code.
While the fastest way to analyze or unpack malware is often to run it,
malware won’t always successfully execute in a VM. I use IDA
Pro’s Bochs integration in IDB mode to sidestep tedious
debugging scenarios and get quick results. Bochs emulates the opcodes
directly from your IDB in a Bochs VM with no OS.
Bochs IDB mode eliminates distractions like switching VMs, debugger
setup, neutralizing anti-analysis measures, and navigating the program
counter to the logic of interest. Alas, where there is no OS, there
can be no loader or dynamic imports. Execution is constrained to
opcodes found in the IDB. This precludes emulating routines that call
imported string functions or memory allocators. Tom Bennett’s flare-emu
ships with emulated versions of these, but for off-the-cuff analysis
(especially when I don’t know if there will be a payoff), I prefer
interactively examining registers and memory to adjust my tactics ad hoc.
What if I could bring my own imported functions to Bochs like
flare-emu does? I’ve devised such a technique, and I call it code
grafting. In this post I’ll discuss the particulars of statically
linking stand-ins for common functions into an IDB to get more mileage
out of Bochs. I’ll demonstrate using this on an EVILNEST sample to
unpack and dump next-stage payloads from emulated memory. I’ll also
show how I copied a tricky call sequence from one IDB to another IDB
so I could keep the unpacking process all in a single Bochs debug session.
EVILNEST Scenario
My sample (MD5 hash 37F7F1F691D42DCAD6AE740E6D9CAB63 which is
available on VirusTotal)
was an EVILNEST variant that populates the stack with configuration
data before calling an intermediate payload. Figure 1 shows this
unusual call site.
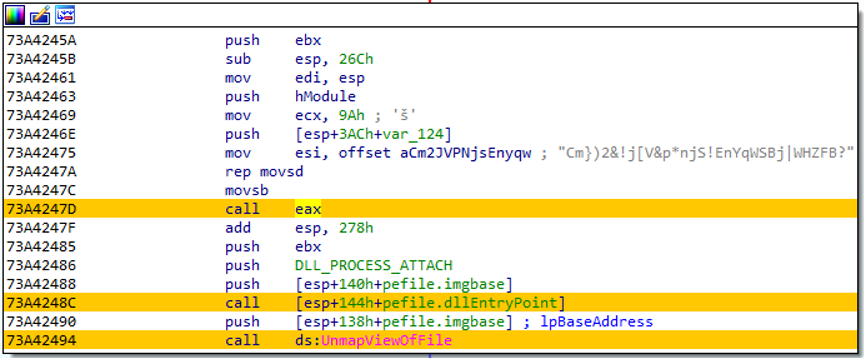
Figure 1: Call site for intermediate payload
The code in Figure 1 executes in a remote thread within a
hollowed-out iexplore.exe process; the
malware uses anti-analysis tactics as well. I had the intermediate
payload stage and wanted to unpack next-stage payloads without
managing a multi-process debugging scenario with anti-analysis. I knew
I could stub out a few function calls in the malware to run all of the
relevant logic in Bochs. Here’s how I did it.
Code Carving
I needed opcodes for a few common functions to inject into my IDBs
and emulate in Bochs. I built simple C implementations of selected
functions and compiled them into one binary. Figure 2 shows some of
these stand-ins.
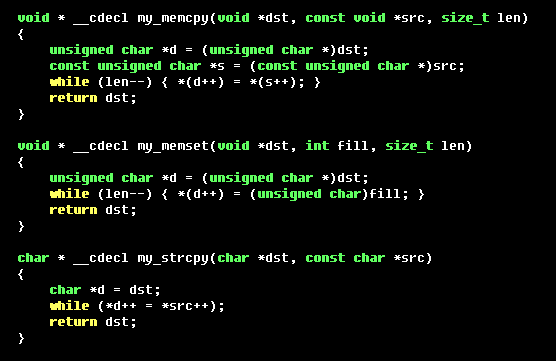
Figure 2: Simple implementations of common functions
I compiled this and then used IDAPython code similar to Figure 3 to
extract the function opcode bytes.
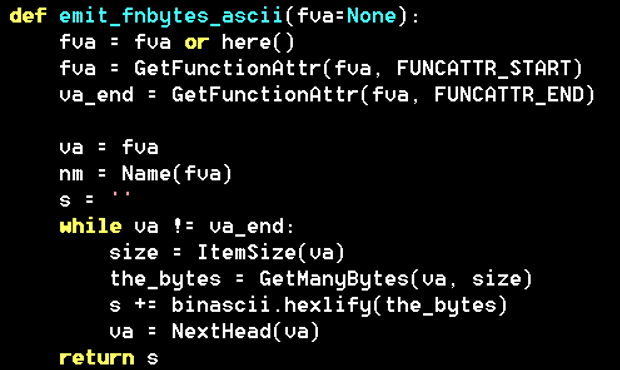
Figure 3: Function extraction
I curated a library of function opcodes in an IDAPython script as
shown in Figure 4. The nonstandard function opcodes at the bottom of
the figure were hand-assembled as tersely as possible to generically
return specific values and manipulate the stack (or not) in
conformance with calling conventions.
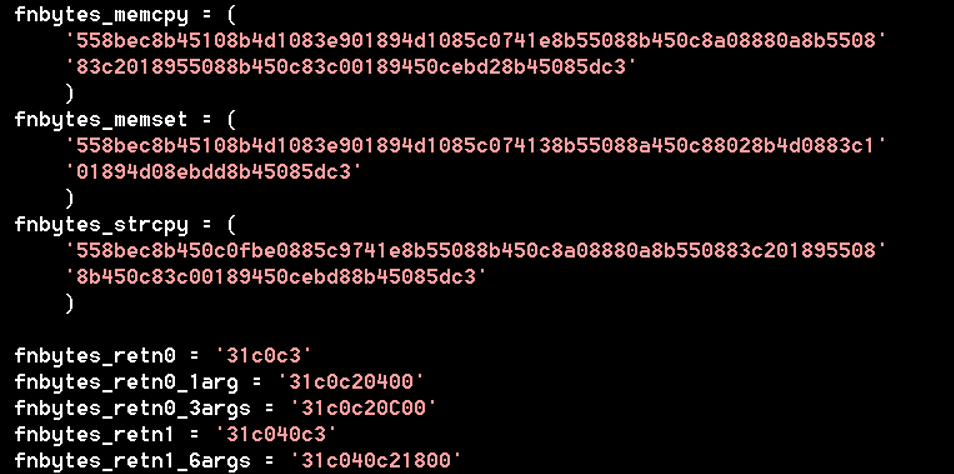
Figure 4: Extracted function opcodes
On top of simple functions like memcpy, I
implemented a memory allocator. The allocator referenced global state
data, meaning I couldn’t just inject it into an IDB and expect it to
work. I read the disassembly to find references to global operands and
templatize them for use with Python’s format
method. Figure 5 shows an example for malloc.
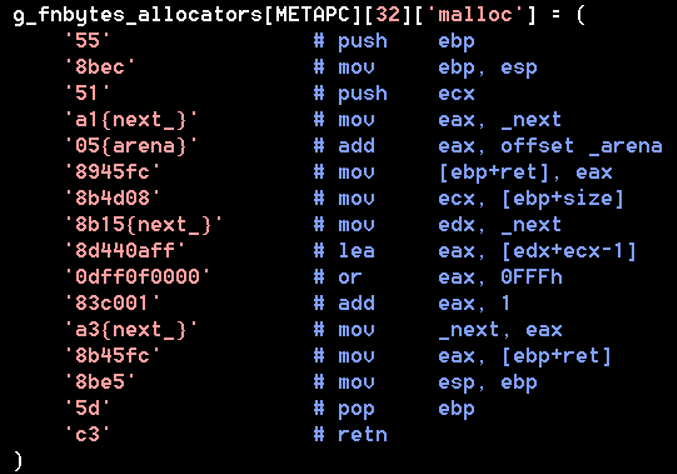
Figure 5: HeapAlloc template code
I organized the stubs by name as shown in Figure 6 both to call out
functions I would need to patch, and to conveniently add more function
stubs as I encounter use cases for them. The mangled name I specified
as an alias for free is operator delete.
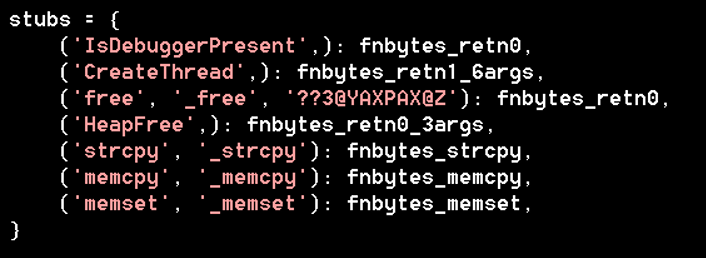
Figure 6: Function stubs and associated names
To inject these functions into the binary, I wrote code to find the
next available segment of a given size. I avoided occupying low memory
because Bochs places its loader segment below 0x10000. Adjacent to the code in my code segment,
I included space for the data used by my memory allocator. Figure 7
shows the result of patching these functions and data into the IDB and
naming each location (stub functions are prefixed with stub_).
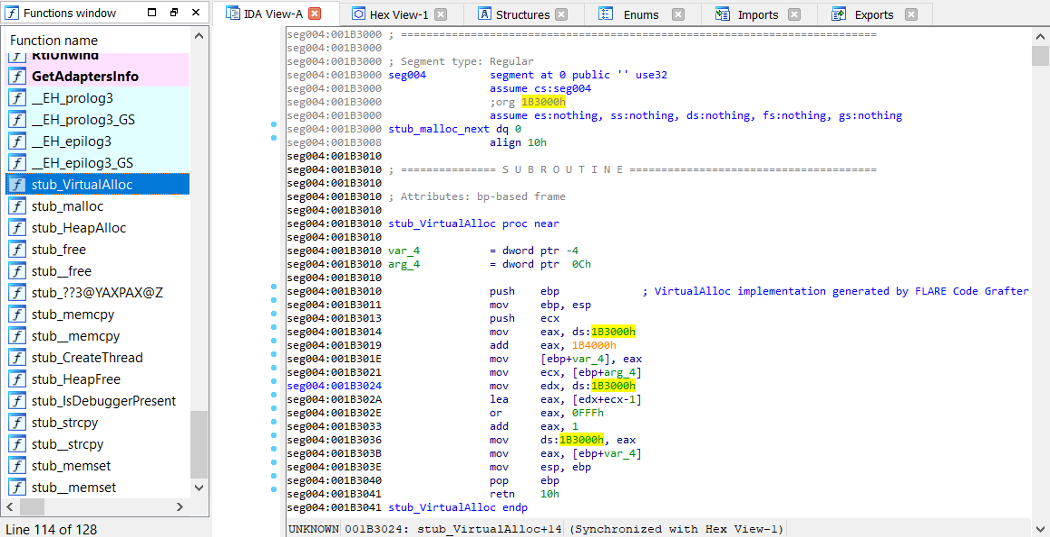
Figure 7: Data and code injected into IDB
The script then iterates all the relevant calls in the binary and
patches them with calls to their stub implementations in the newly
added segment. As shown in Figure 8, IDAPython’s Assemble function saved the effort of calculating
the offset for the call operand manually.
Note that the Assemble function worked well
here, but for bigger tasks, Hex-Rays
recommends a dedicated assembler such as Keystone Engine and its
Keypatch
plugin for IDA Pro.
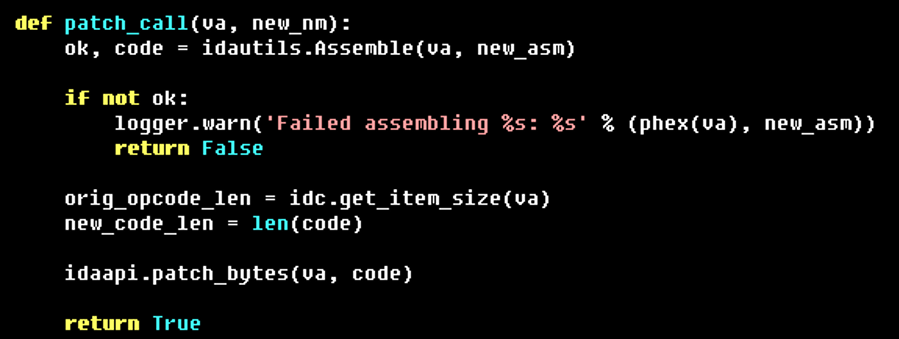
Figure 8: Abbreviated routine for
assembling a call instruction and patching a call site to an import
The Code Grafting script updated all the relevant call sites to
resemble Figure 9, with the target functions being replaced by calls
to the stub_ implementations injected
earlier. This prevented Bochs in IDB mode from getting derailed when
hitting these call sites, because the call operands now pointed to
valid code inside the IDB.
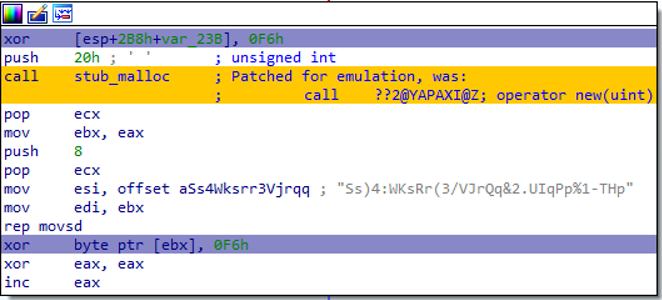
Figure 9: Patched operator new() call site
Dealing with EVILNEST
The debug scenario for the dropper was slightly inconvenient, and
simultaneously, it was setting up a very unusual call site for the
payload entry point. I used Bochs to execute the dropper until it
placed the configuration data on the stack, and then I used
IDAPython’s idc.get_bytes function to
extract the resulting stack data. I wrote IDAPython script code to
iterate the stack data and assemble push instructions into the payload
IDB leading up to a call instruction pointing to the DLL’s export.
This allowed me to debug the unpacking process from Bochs within a
single session.
I clicked on the beginning of my synthesized call site and hit F4 to
run it in Bochs. I was greeted with the warning in Figure 10
indicating that the patched IDB would not match the depictions made by
the debugger (which is untrue in the case of Bochs IDB mode). Bochs
faithfully executed my injected opcodes producing exactly the desired result.
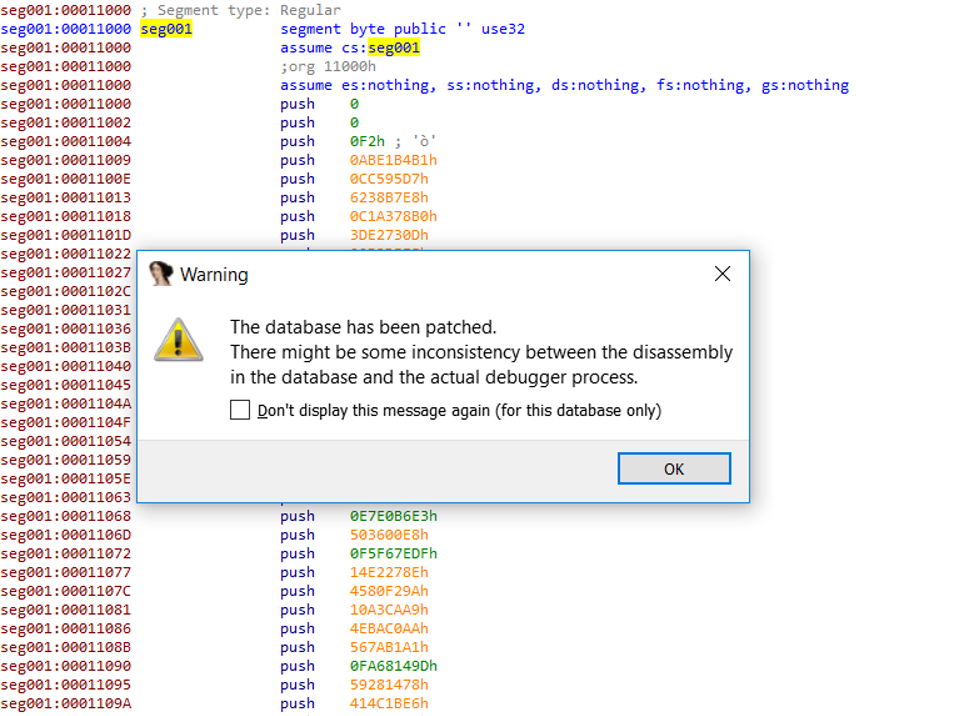
Figure 10: Patch warning
I watched carefully as the instruction pointer approached and passed
the IsDebuggerPresent check. Because of the
stub I injected (stub_IsDebuggerPresent), it
passed the check returning zero as shown in Figure 11.
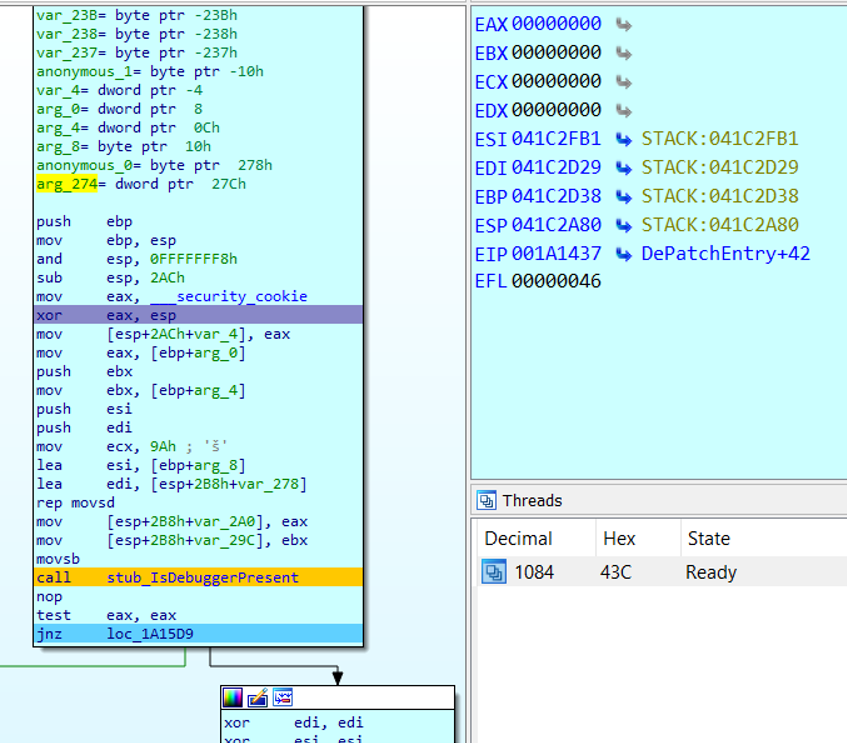
Figure 11: Passing up IsDebuggerPresent
I allowed the program counter to advance to address 0x1A1538, just beyond the unpacking routine.
Figure 12 shows the register state at this point which reflects a
value in EAX that was handed out by my fake
heap allocator and which I was about to visit.
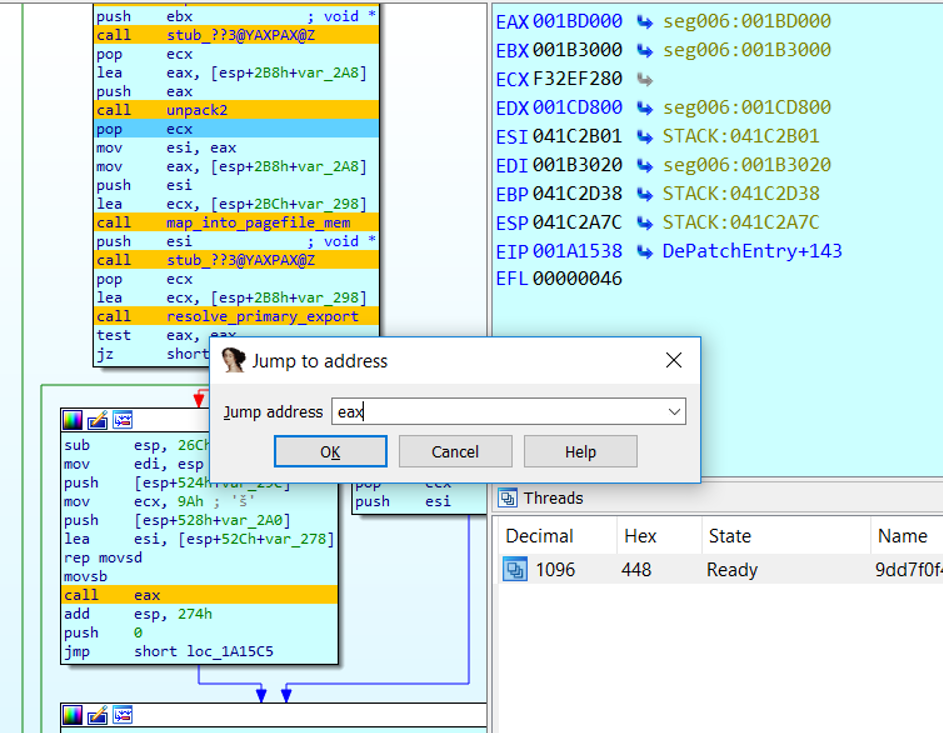
Figure 12: Running to the end of the
unpacker and preparing to view the result
Figure 13 shows that there was indeed an IMAGE_DOS_SIGNATURE (“MZ”) at this location. I
used idc.get_bytes() to dump the unpacked
binary from the fake heap location and saved it for analysis.
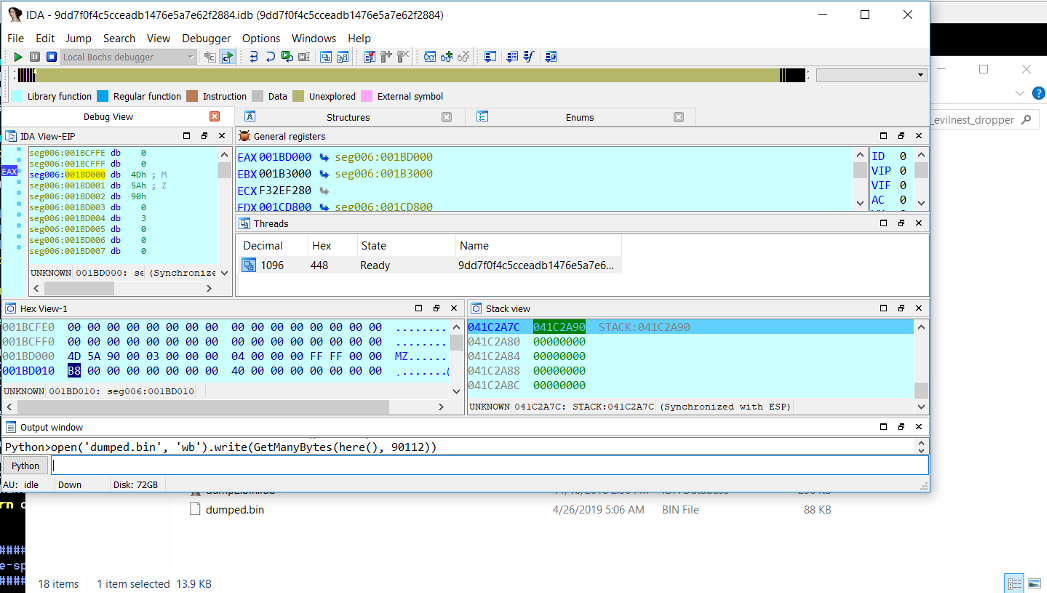
Figure 13: Dumping the unpacked binary
Through Bochs IDB mode, I was also able to use the interactive
debugger interface of IDA Pro to experiment with manipulating
execution and traversing a different branch to unpack another payload
for this malware as well.
Conclusion
Although dynamic analysis is sometimes the fastest road, setting it
up and navigating minutia detract from my focus, so I’ve developed an
eye for routines that I can likely emulate in Bochs to dodge those
distractions while still getting answers. Injecting code into an IDB
broadens the set of functions that I can do this with, letting me get
more out of Bochs. This in turn lets me do more on-the-fly
experimentation, one-off string decodes, or validation of hypotheses
before attacking something at scale. It also allows me to experiment
dynamically with samples that won’t load correctly anyway, such as
unpacked code with damaged or incorrect PE headers.
I’ve shared the Code Grafting tools as part of the flare-ida GitHub
repository. To use this for your own analyses:
- In IDA Pro’s IDAPython prompt, run code_grafter.py or import it as a module.
- Instantiate a CodeGrafter object and
invoke its graftCodeToIdb() method:- CodeGrafter().graftCodeToIdb()
- Use Bochs in IDB mode to conveniently execute your
modified sample and experiment away!
This post makes it clear just how far I’ll go to avoid breaking eye
contact with IDA. If you’re a fan of using Bochs with IDA too, then
this is my gift to you. Enjoy!